

Wish you could create breathtaking charts, diagrams, and graphs? Blend beautiful landscapes into the background of your graph? Show children learning on a graph featuring student growth? Step aside, Google and Microsoft. Canva’s Charts app puts powerful tools at your disposal. What’s more, this app makes it easy to import comma-delimited (CSV) lists! You can pull data from spreadsheet or database exports, and then generate documents, graphs, or charts. Let’s explore how to:
- Use Canva’s Charts app
- Customize your graphs and charts
- Create specialized graphs
- Import rows of data from a spreadsheet or database for mail merge purposes
- Generate parent letters and certificates via mail merge
Using Canva’s Charts App
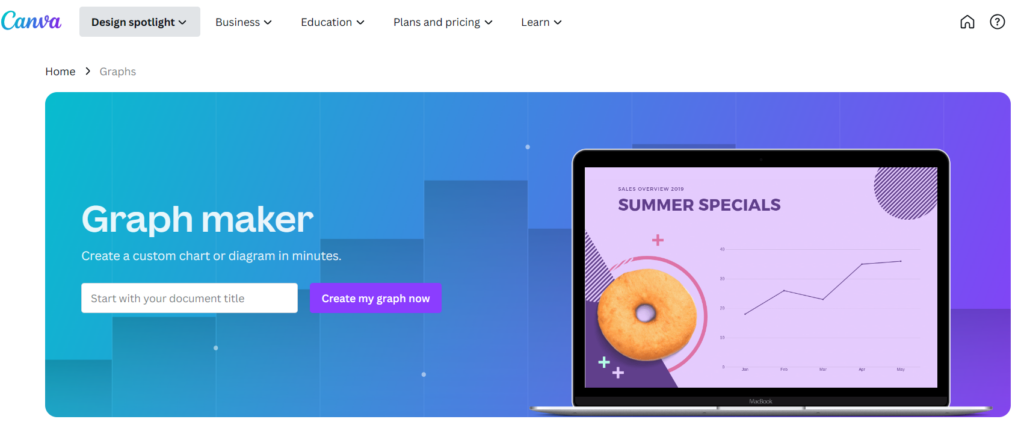
Canva dedicates an entire website to graph templates. It’s a gateway to all the exciting graph and chart templates Canva offers. Per the website, you can:
- Choose from more than 20 types of graphs
- Embed your graph in presentations and reports
- Publish, share, or download your high-resolution graph
- Fast-track development with professional templates
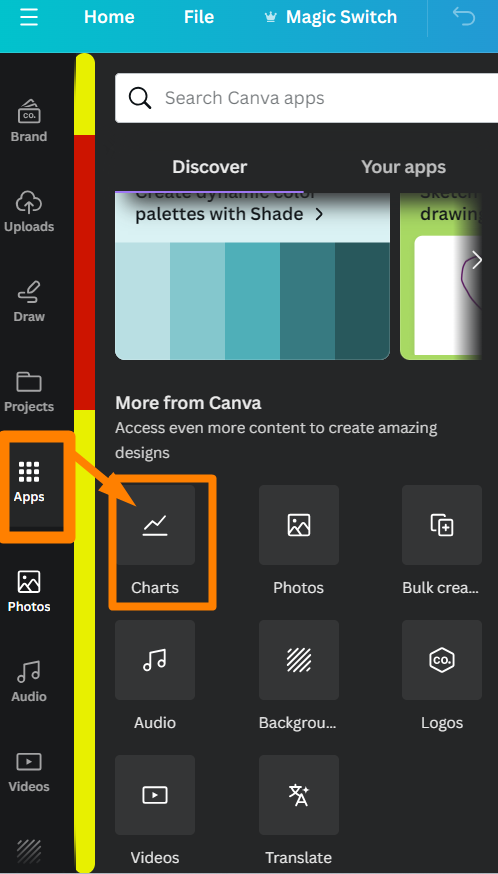
Of course, Canva’s Charts app can do so much more. Let’s take a look at the Charts app, found in the Canva sidebar menu under the Apps icon:
You already have a ton of templates for charts and graphs available in Canva’s Elements. But Canva’s Charts app also offers you customizable charts with data tables. I feature them in my video walkthrough:
Customize Charts and Graphs
You can customize the data in your charts and graphs via their accompanying data table. Be aware that there are many graphs in the Elements –> Graphics section that you cannot adjust via a data table. If you want to adjust these, you’ll be “eyeballing it” or estimating instead.
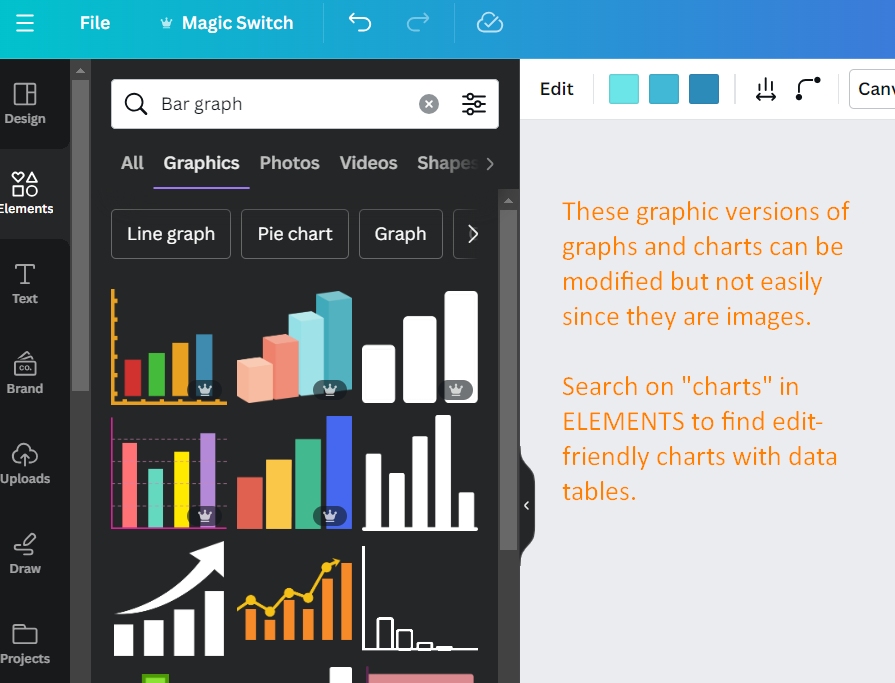
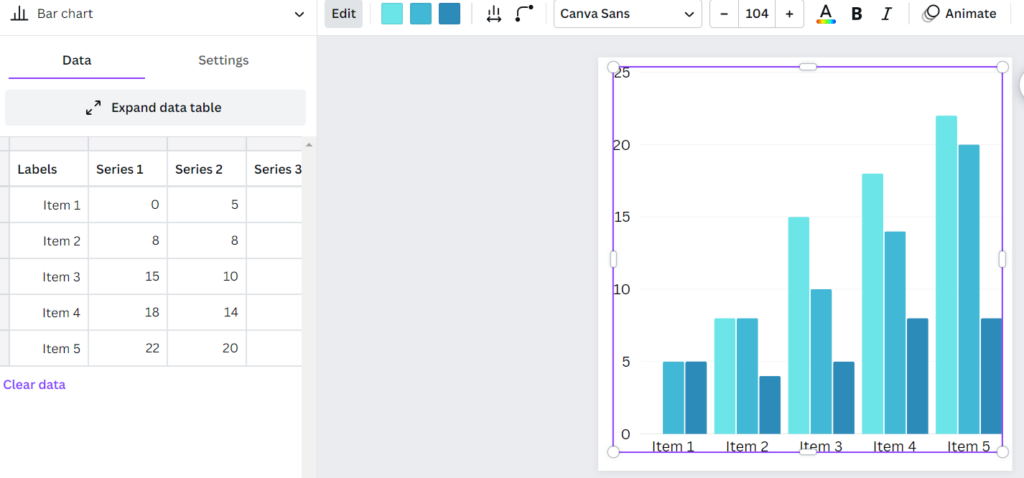
For more precise charts based on data, you will need to rely on searching “charts” in the Elements. These do come with a data table. These charts are usually in shades of blue but the colors are customizable. As you can see from the screenshot, the data table appears when you click on the editable chart on the canvas.
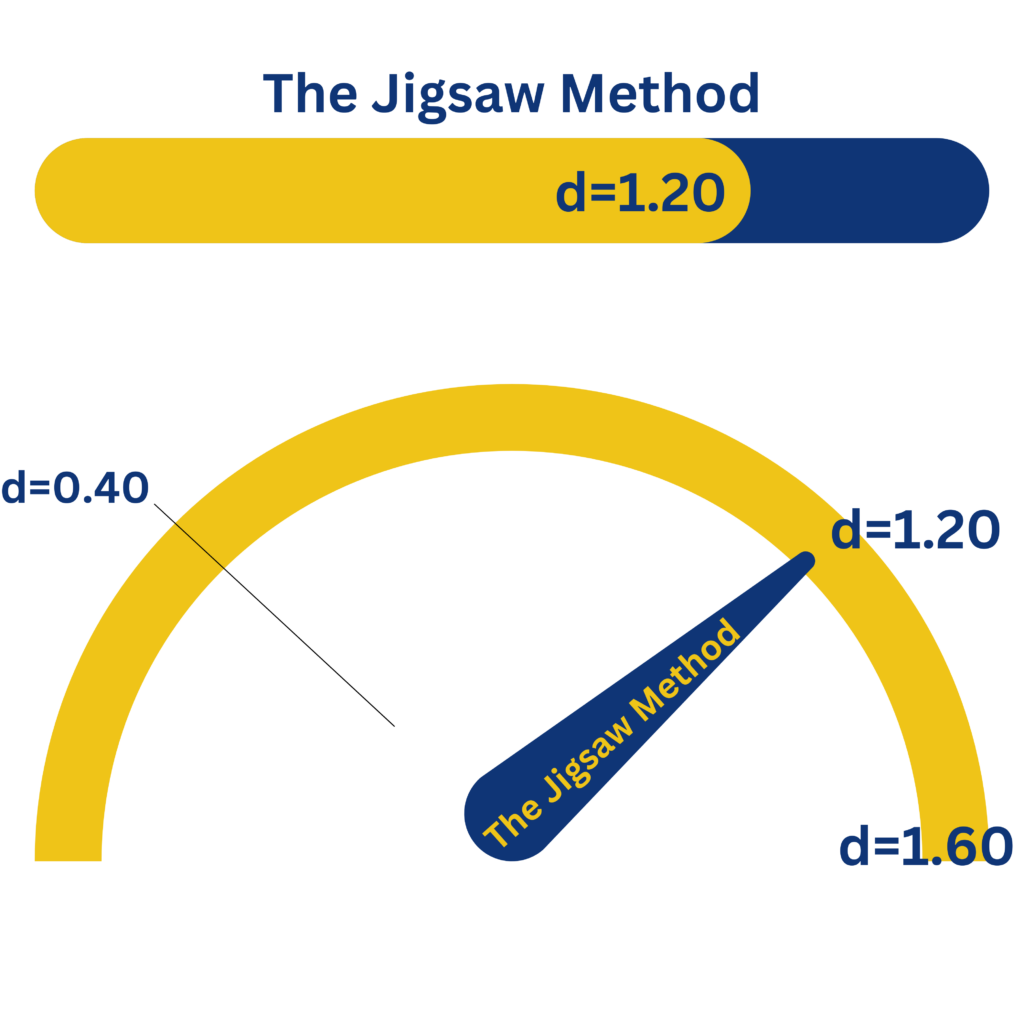
You can also create specialized graphs, such as progress bars, progress dials, and pictograms. Let’s take a closer look.
Create Specialized Charts and Graphs
With customizable charts in Canva’s Charts App, you can create a progress bar with precision:
Another fun chart to work with is the pictogram. You have a variety of icons to choose from. As you can see in the screenshot below, pictograms resemble what they signify. So it’s great that Canva offers this option.

You can also create your own pictogram from images in Canva Elements:

Canva Certificates and Letters
Need to send home a progress report, or print off certificates of achievement for your students or colleagues? Canva makes it easy! All you need to do is:
- Prepare your merge document (e.g. certificate, document, handout, etc.), and
- Have your data in a CSV file or Google Sheet
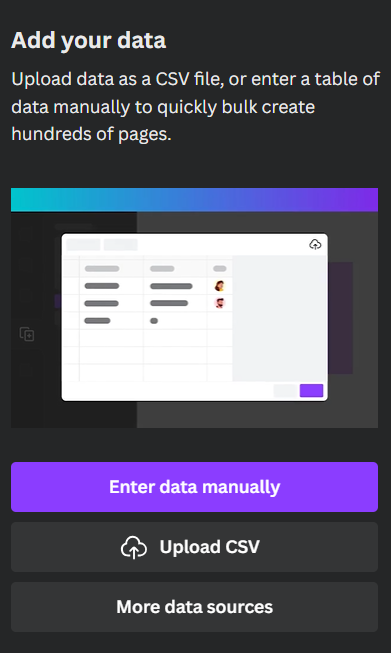
You can use one of two apps to get CSV data into Canva for use. The first is to rely on the Chart app. It has a built-in import tool. The second is the Bulk Create app, which is available via Apps in your Canva sidebar.
This short video demonstrates how I use these two approaches. You will see certificate creation first. Then, I create a chart using data exported as a CSV file. It’s easier than you think, and what a time-saver!
The Canva Charts App Makes Things Easy
It’s amazing to see how easy it is to create beautiful graphs and charts with Canva. With the ability to import data from spreadsheet programs like Excel and Sheets, you can generate a nice chart or series of certificates. How will use the Canva Charts app? Share your ideas in the comments!