

How can you better develop graph and chart analytical skills with your students? One way is to have them explore and analyze graphs, then discuss what they have learned and think. Another is to create graphs. Let’s take a look at some ways you can do that.
Check out this Google Slides deck of Graphs, Correlation, and Causation. It can assist in teaching about how graphs and statistics can be used to mislead, an appropriate lesson for secondary students.
How to Teach What Graphs Mean
See the quote below for a common problem in classrooms. As a student, this quote reflects my experience with graph skills. And, from a teacher’s perspective, this is spot-on:
Last year, students frustrated me. They could graph lines and do the math. But, they didn’t understand what the graphs and equations meant.
I saw this when they couldn’t tell if answers were reasonable. They also couldn’t explain the graphs beyond the basics.
I knew I needed to get them thinking deeper about what the graphs show. That way the numbers would mean more. I wanted complex problems for them to spend more time on, doing more with fewer problems. (adapted for readability from source: Rachel at Idea Galaxy)
So, how do you teach graph skills? What graphs mean? What they represent? My answer? Focus on having students create graphs based on data they collect. Let’s take a look at some alternate approaches for analyzing graphs. Then, we will explore some digital tools for making graphs.
Teaching Students Graph Analysis Skills
There are many ways to analyze graphs that follow an approach like the one below:
- Read the title and make predictions about the graph.
- Read the axes and the labels and ask, “How are these related?”
- What is the relationship in the data and how does the data change?
- What units of measurements did the designer use?
- Study the data values to understand how big the differences shown are
Often, graph design is poor, and this affects students’ graph analysis skills. You have to work extra hard to ask questions that engage your mind. For some students, nothing pops into their mind when they look at a graph or chart, which makes teaching graph analysis and design important for critical thinking.
Guiding Questions for Graph Analysis Skills
Finally, I always dig into my back pocket for some questions. Here are a few that pop into my mind when I’m looking at a graph for the first time. They might be helpful when teaching students graph skills.
- What kind of graph is being used to represent data?
- Is that graph type the right one for the data? Why or why not?
- What colors did the graph designer use and do they mean anything?
- Why was this data chosen to present? What makes it special?
- What are some reasons for the differences in the data?
- What do I need to learn or understand better to see how and why this graph is important?
- How do I know this data is valid and reliable?
- What’s the proof or evidence?
- What is meant by this data?
- What does it symbolize?
- What does it mean for me? For others?
It never hurts to equip students with questions they can ask. Building a habit of graph analysis and design is the next step.
Resources for Analyzing Graphs and Charts
Here are some resources that provide background knowledge for graph and chart analysis:
- How to Write an IELTS Line Graph Essay
- Khan Academy Graph Interpretation (Algebra I)
- Graphs for Kids
- 1st Grade Bar Graphs
- Math Antics’ Data and Graphs
Tools for Making Graphs
Making graphs is one of my favorite ways to get students thinking and analyzing. I have a round up of five simple graphing tools you can explore, but here are two of my favorite graphing tools to teach graph making skills.
1. Kids’ Zone Create a Graph
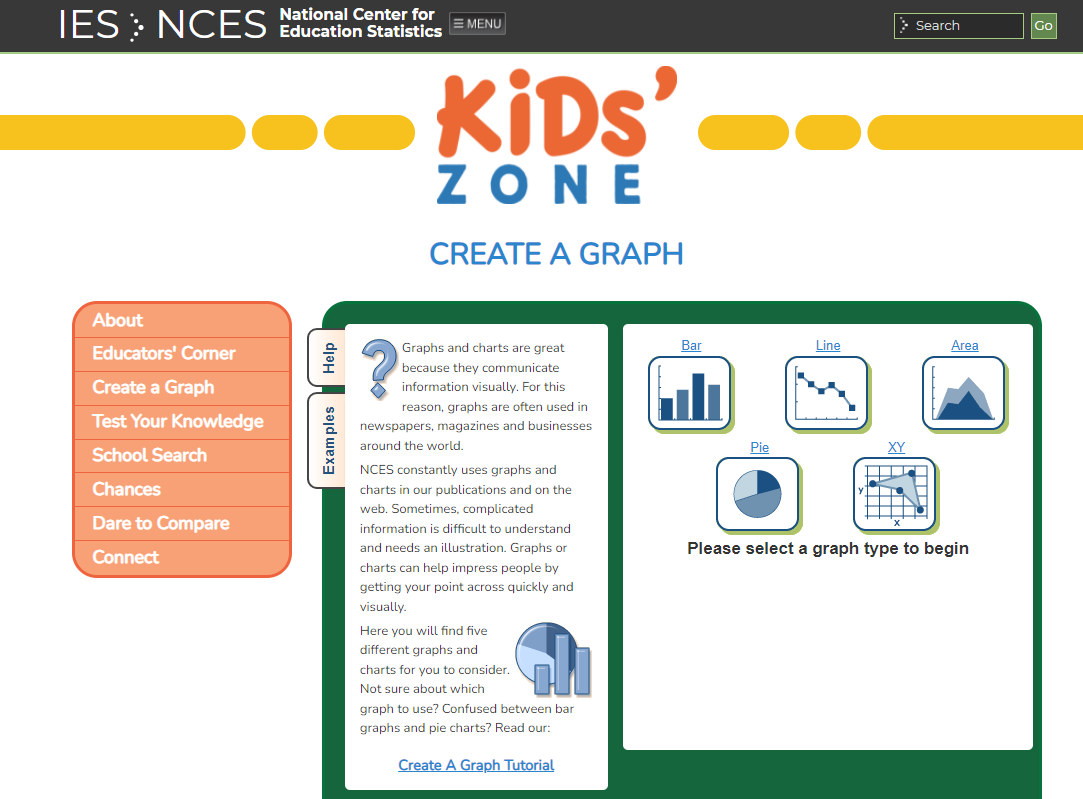
This is one of my all time favorite graph creation tools. It’s easy to use via the web and works great on Chromebooks. It’s not too complicated! I’ve used it with third grade and sixth grade students.
2. Imgflip’s Chart Maker
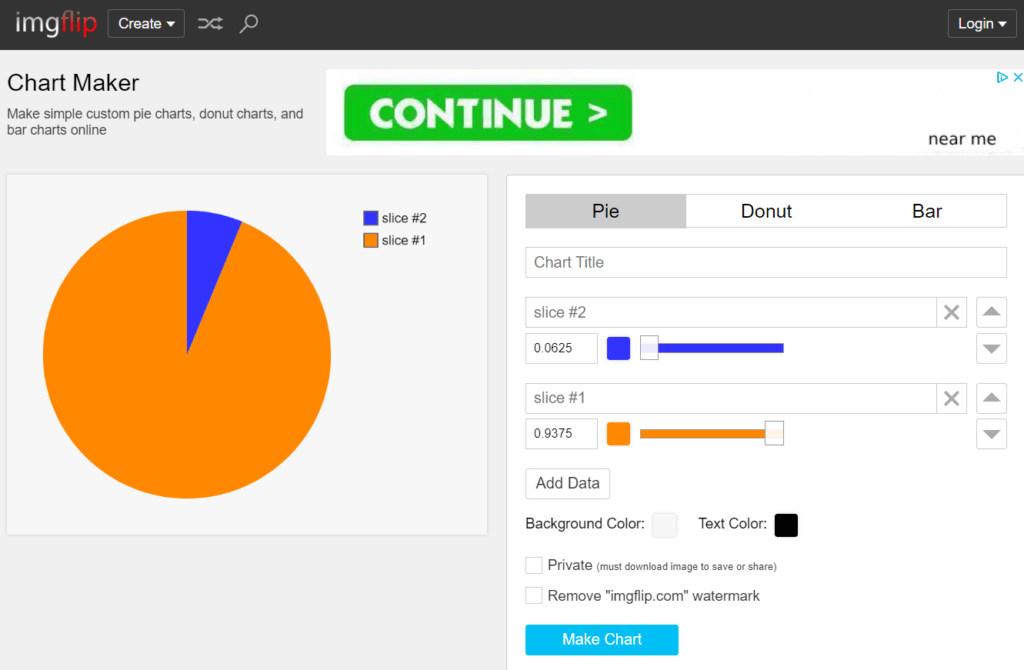
This graph and chart-making tool is drop-dead easy. You can make pie, donut, or bar charts via your web browser. And you can change colors.
With those two powerful tools, you will have students designing graphs in no time. But wait, what kinds of graphs could you start with? What data sets could you use for teaching graph skills?
Additional Tools for Older Students:
- ChartBlocks
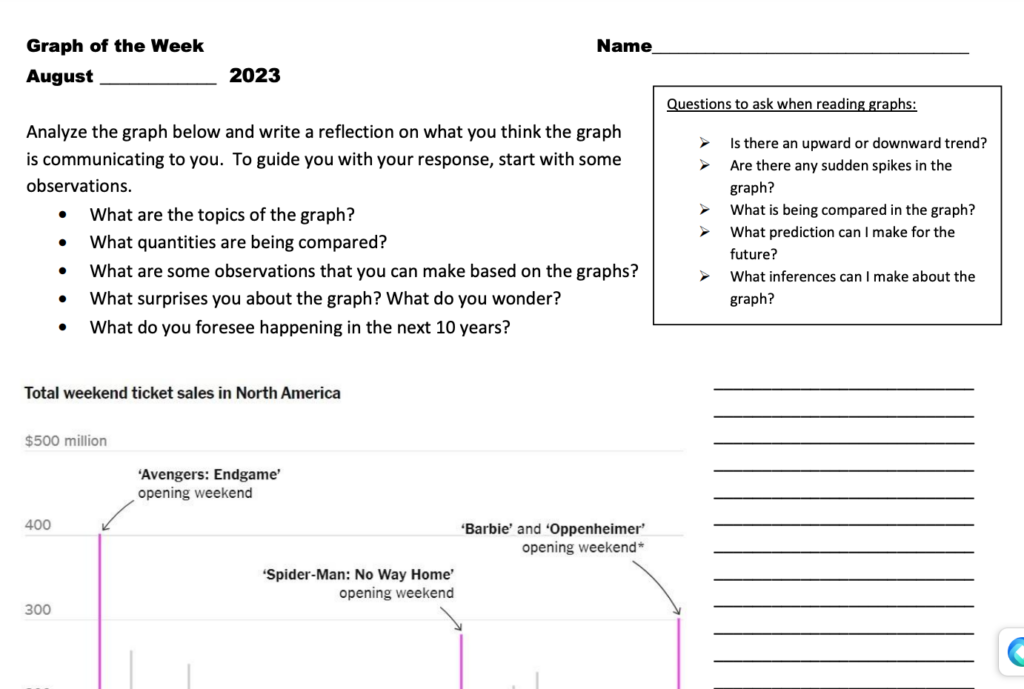
- Graph of the Week Template by Idea Galaxy
- Canva’s graph maker
Make Your Own Data Sets
Want to get students to graph data? Hands-on experiences and labs are one way to do that. You want students to recognize that graphable data surrounds them.

Here are some quick data sets and activities from various sources that can get your started with teaching graph analysis skills:
- Animals at the Zoo
- Bar Graphs, Line Plots
- Chores Bar Graphs and Pictographs
- Class Data Display
- Favorite colors
- Graphing Templates
- Hershey Kisses Toss (e.g. Desmos, Course Hero)
- Jelly bean data
- M&M Graphing Activity
- Skittles Sort and Count
- Spaghetti Marshmallow Tower Challenge (record height, spaghetti, and marshmallows used)
Graphs for Students to Analyze
Graphs and charts surround us. Let’s take a look at several graphs and charts you can use in the classroom.
1. Turner’s Graph of the Week (GOW)
Kelly Turner’s Graph of the Week website wants to help students become “lifelong critical and analytical thinkers.” They also hope to achieve the following:
- Improve academic literacy
- Develop students engaged in civics through oral discourse
- Link mathematics to real-world situations
- Develop students’ Habits of Mind
- Improve written communication
- Give students current events awareness
You will find a very long list with a variety of graphs to analyze for the current school year and in the 2013-last school year’s archive. Don’t be afraid to make your own! This is a great resource for teaching and reviewing graph analysis skills.
2. Using Graphs for Writing to Learn
This particular collection (view-only link) is available as a Google Doc of instructions (make-a-copy link). Find it via MiddleWeb‘s blog. It offers specific suggestions, such as:
- Give the title of the graph.
- Describe the picture/shape of graph.
- Summarize the information given in the graph.
- Give statistics and results included in the graph.
- State the source of the information.
- Give your opinion of the results.
- Explain how the information relates to you or the world around you
Students then review a series of graphs and charts. They follow the instructions included to write about it. Then, as an extension activity, they create an infographic of their data. Great way to put graph anaylsis and making skills into practice! You can get some more ideas about infographics from these TechNotes articles.
3. Next Graphs + Charts
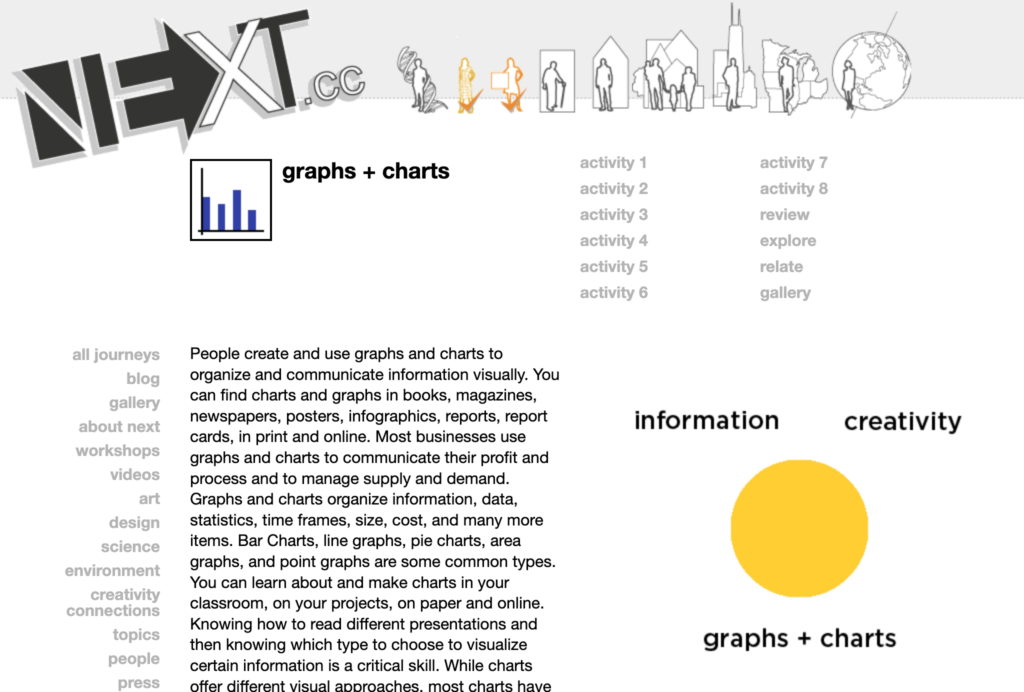
This website encourages students to become graph graphic designers. With that goal in mind, you will find seven activities to assist you with teaching students graph design skills. A short list of the activities appears below:
- Activity 1 – collect charts and graphs
- Activity 2 – parts of graphs and charts
- Activity 3 – direct a pie chart
- Activity 4 – build a bar chart
- Activity 5 – area graphs
- Activity 6 – point plots
- Activity 7 – variables
- Activity 8 – identify and interpret
At the end, students can take a short quiz about key concepts. This is a valuable resource that provides a lot of great ideas and suggestions. The information is bite-sized, so your students won’t be overwhelmed with information.
What’s more, you will find pages of information on topics including area, coding, diagramming, grids, temperature, and more.
4. Problem-Attic
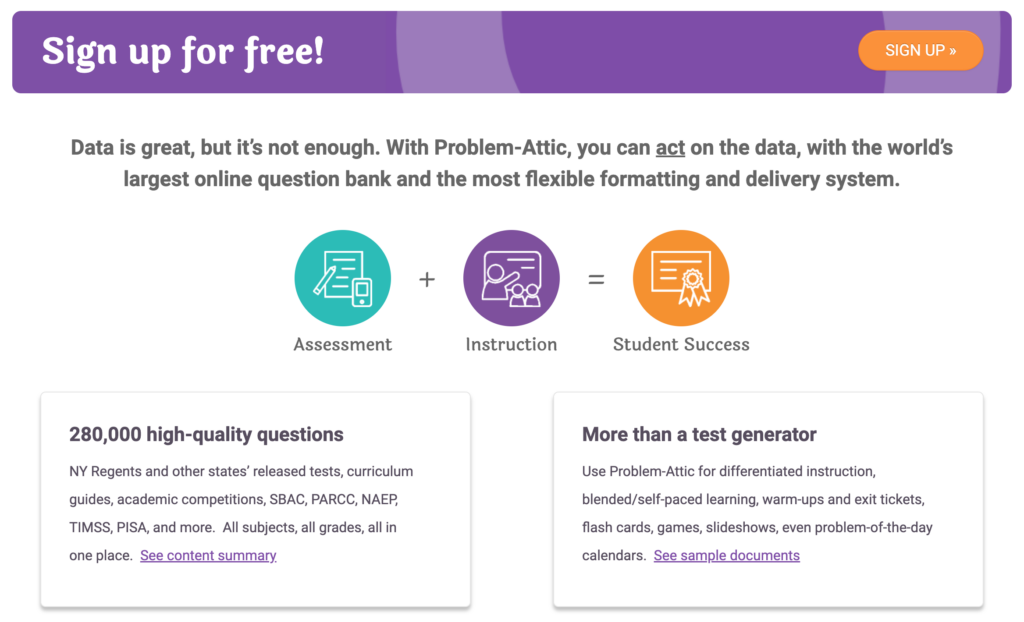
Looking for incredible graphs aligned to curricular concepts? Explore Problem-Attic. You get access to a question bank with 280,000 questions, and it offers many more features. One feature I like is you can search for graphs, then export quizzes to your learning management system of choice (e.g. Schoology, Canvas, Google Forms Quiz, etc.). Or you can create a slideshow with instant feedback via QR code and website.
5. Tuva Labs Content Library
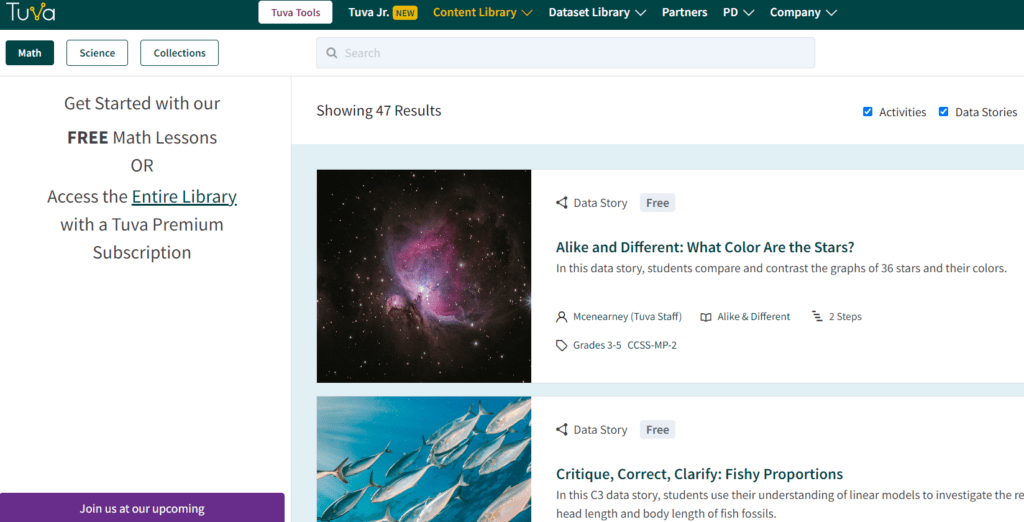
Tuva Labs offers a rich collection of graphs and content you can use in your science class for teaching analysis skills. Their searchable content library, which includes both free and premium offerings, has rich content resources.
Some graph relevant links include the following:
- Zoom in On Beach Trash
- Be Specific with Your Heat
- Alike and Different: Where Did the Dinosaurs Roam?
AI Graph Makers
Once you’ve had a chance to work with graph reading, analysis, and design, check out these AI tools. These AI graph makers can certainly help:
Give these a shot later on when students are comfortable with their skills reading and analyzing graphs.
If you’re wanting to get up to speed on better analysis of graphs before working with your students, here is a great video for you:
Now that you have a wealth of tools, remember, it’s about getting students to analyze the graph, ask tough questions about the data the graph is based on, and why it matters.