

Want to make stylized graphs? You may find yourself reaching for Microsoft Excel or Google Sheets. Both offer a wealth of graphs you can take advantage of. But what about simple graphing tools to enhance teaching and learning or to make a quick illustration of a point?
I’m not talking about tools like these, which are excellent for graphing math or science data sets (you can find even more at CommonSense.org.):
No, I’m talking about fun graphing tools. My criteria for fun graphing tools? They must:
- Be drop-dead simple and easy to use
- Include fun graph styles that aren’t skinny, business graphs
- Be browser-based
- Not require an account
- Of course, be fun to work with.
Let’s take a look at my five favorites.
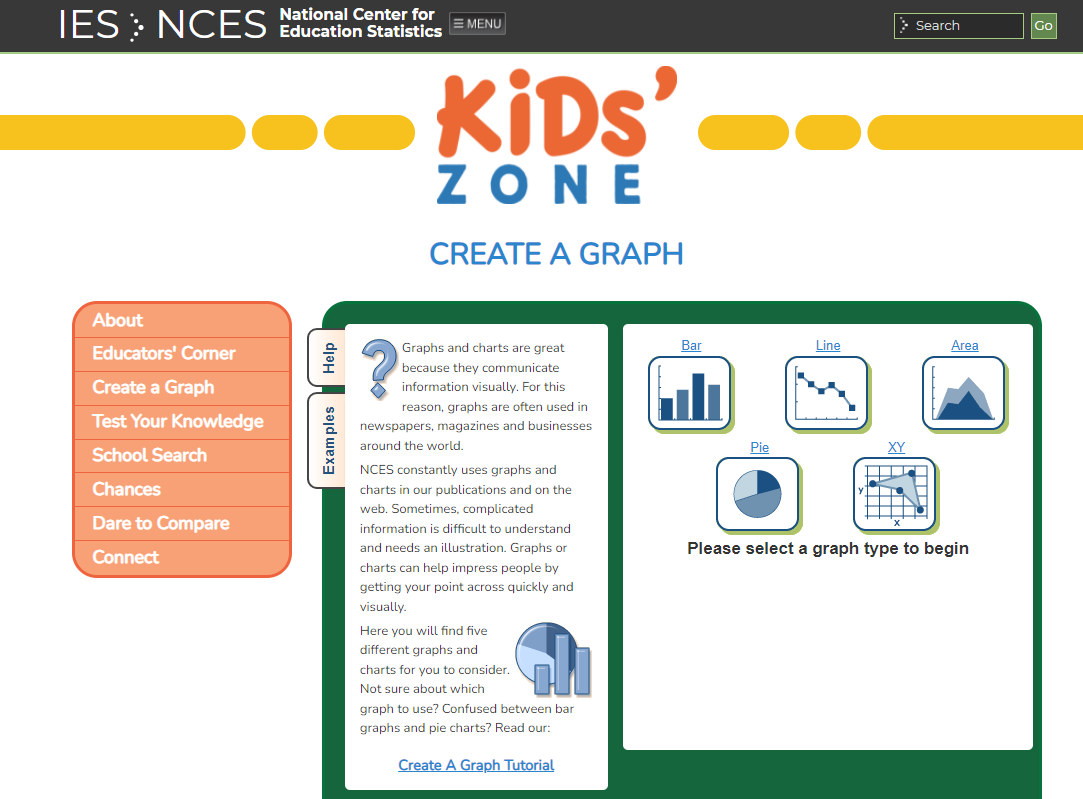
Tool #1: Create a Graph
Coming at us from the National Center for Education Statistics (NCES), you can have a lot of fun with this tool. Its Create a Graph offers a way to make visual communication easier. With this tool, it’s easy for you or your students to create bar, line, area, pie, and XY graphs. Give it a try!
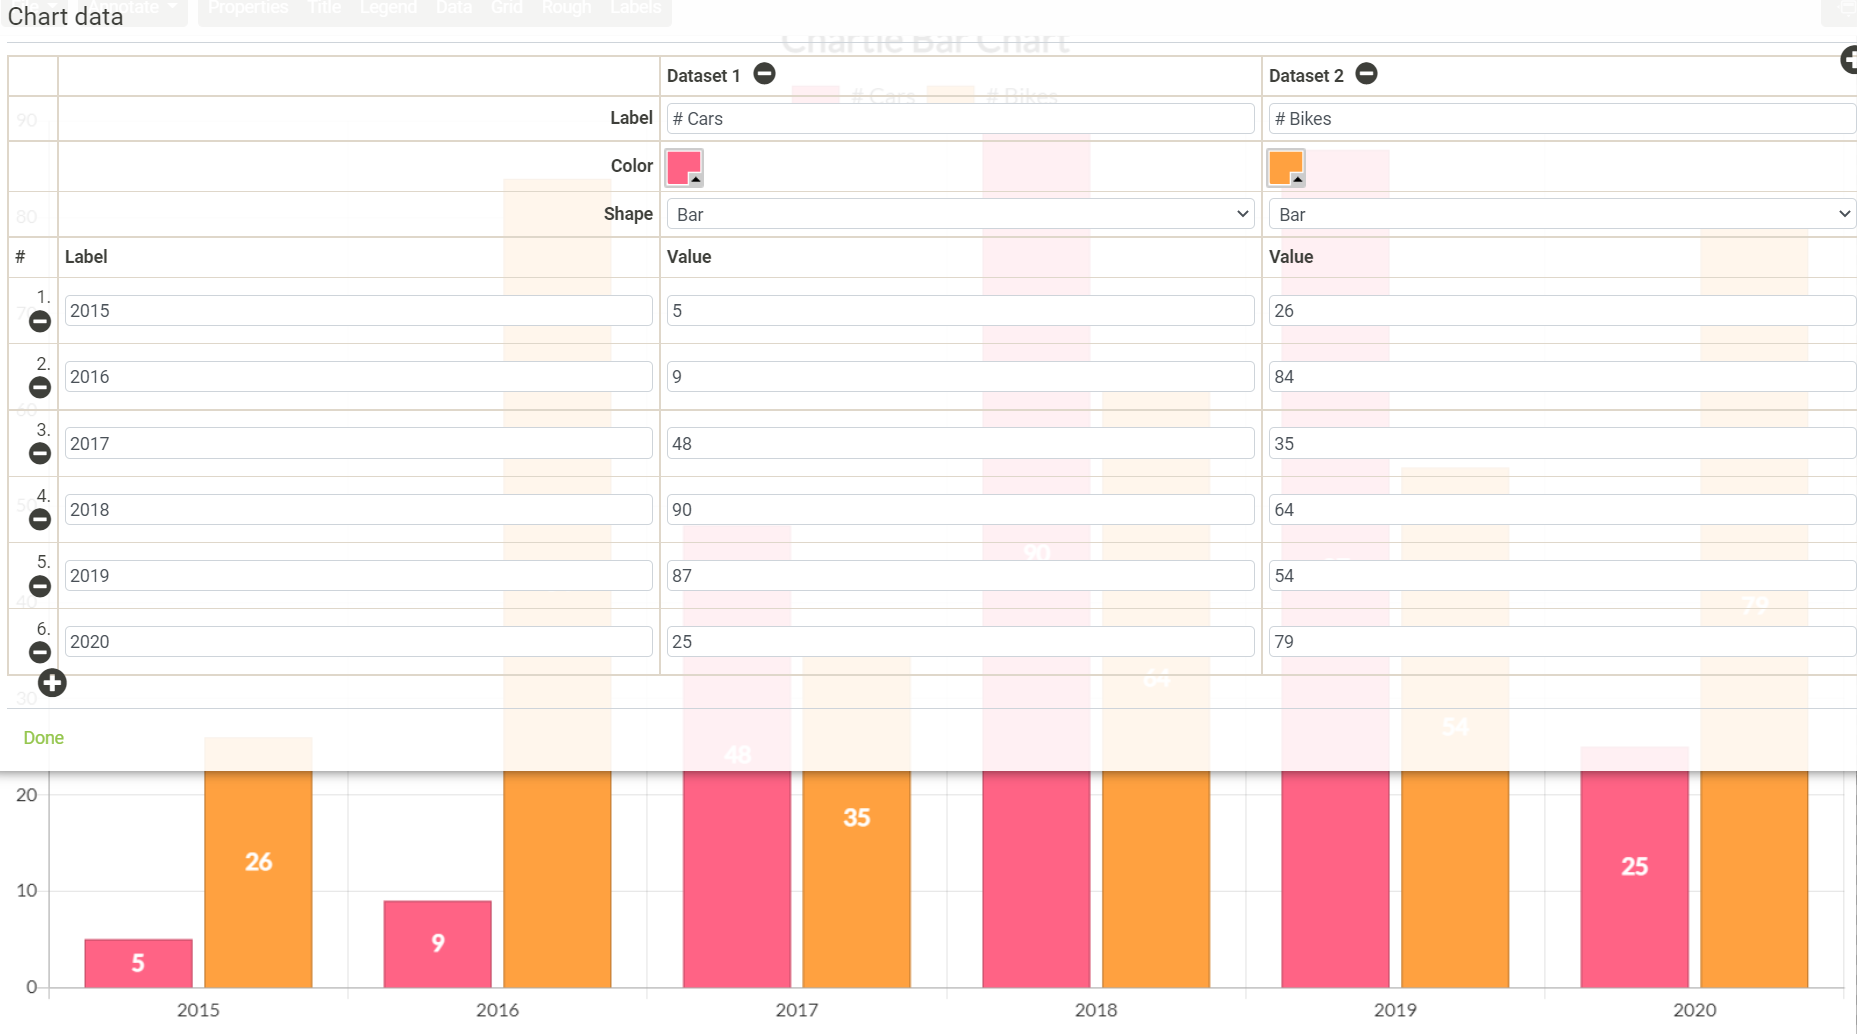
Tool #2: Chartle
Chartle is an easy-to-use online graphing tool that allows you to make line charts, bar graphs, bubble charts, pie charts, and donut charts. You can also generate scatter, radar, and polar graphs. And look at those colors. Now that’s fun.
Tool #3: Plovtar
This graphing tool makes it easy to make and share graphs with others. You can create a line graph, pie chart, bar graph, or live graph. It also includes graph samples you can look at before getting started. Try Plovtar out and see if it really is the easiest graph maker.
Tool #4: Online Charts
This online charts tool offers more graphs than the other tools featured above. Take a look at these colorful examples:
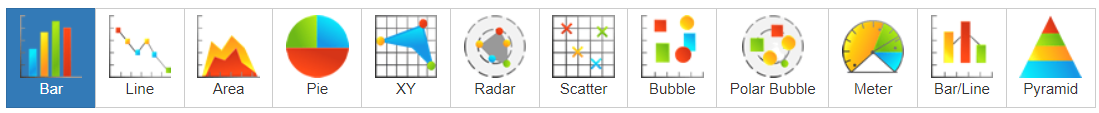
Although setup requires a few clicks, it has a wizard that guides you through data entry. Online Charts also offers cool fonts that will appeal to any middle or high schooler’s sensibilities. You can save the graphs you create in a variety of formats, such as SVG, PNG, JPG, PDF, or export data as CSV. And you can save your chart for further editing later.
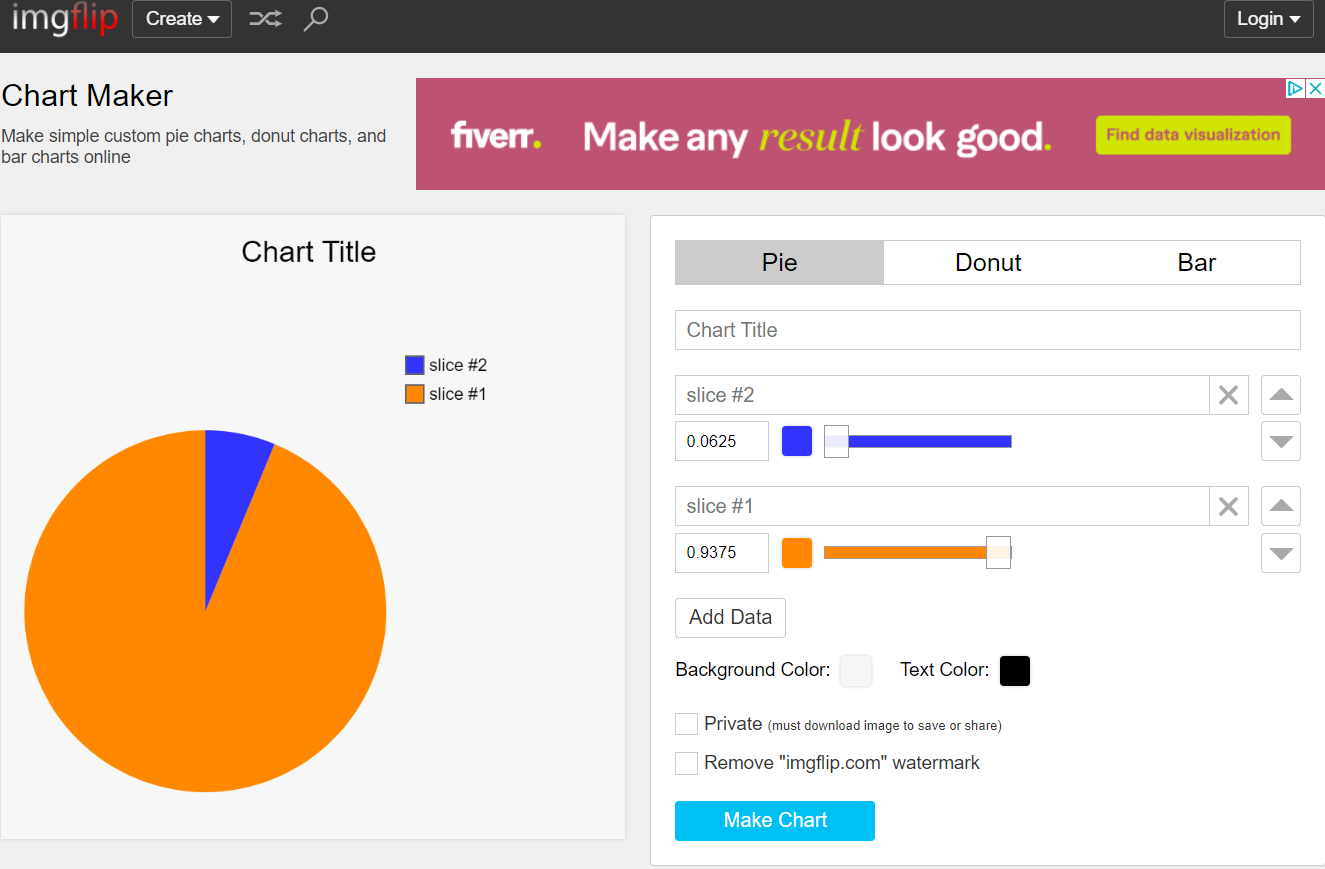
Tool #5: ImgFlip
The ImgFlip Chart Maker is easy as pie. While other chart makers offer lots of choices, this one keeps it simple. You do have some options for customizing your chart and text colors. And you get only three types of graphs: pie, donut, and bar.
Why Use Simple Graphs?
If you’re wondering about fun, simple graphing tools and why they are necessary, allow me to share how I relied on similar tools. It’s easy to get carried away and expect students to start using adult tools. But simple tools like The Graph Club, which I used with kinder through third grade students, are both easy to grasp and easy to use. They introduce students to graphing in a fun, easy way and prevent any frustrations that may come with more complexity.
Here’s one way someone described it:
Students can construct visual representations of information they have read. This can include analyzing, comparing, interpreting and synthesizing information.
With some graphing tools, you can combine pictures and images. These help young children describe their ideas in a concrete manner. Manipulating graphs fosters higher level comprehension skills like reasoning, evaluating, and synthesizing.
Practice with linking concepts in literature and math. It helps young children form new connections with text. Also, it fosters the transfer of thinking skills from one context to another.
With graphing tools, teachers can link literature and non-fiction texts to math tasks. These tasks enrich a young child’s experiences with books.
Who can argue with that explanation? It remains as true today as when it was first written.
There you go, my roundup of fun graph makers. Do you have any you prefer? If so, let us know in the comments.
Feature Image Source
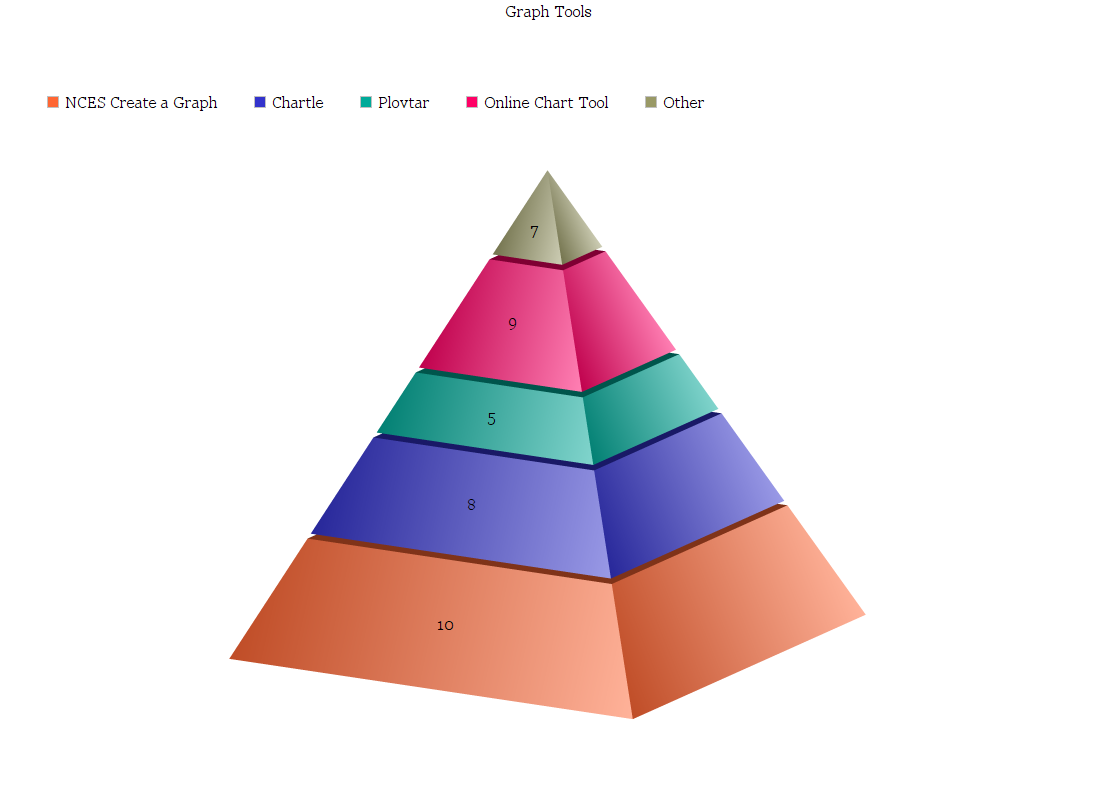
Example pyramid. Screenshot by author