

This post was originally published October 30, 2015. It was updated with new information on February 26, 2021.
Pineapple charts can help educators from missing the amazing things that are happening every day in classrooms. You may not be aware of what your colleagues are doing because you are so busy with your own students. Mark Barnes and Jennifer Gonzalez, authors of Hacking Education: 10 Quick Fixes for Every School, use pineapple charts as a brilliant and easy solution.
What is a Pineapple Chart?
If you have a lesson planned that you believe other teachers might be interested in, whether it’s for a particular teaching technique you’ll be using, a new tool, or a powerful way to differentiate learning, you post that information in the faculty workroom (or anywhere teachers gather) on a pineapple chart. The chart is based on the idea of a pineapple as a symbol of welcome and includes all the days of the week and each period of the day. You post your interesting lesson on the chart on the specific day and time when you’ll be teaching it and thus invite your colleagues in to watch you in action. Here’s a sample.
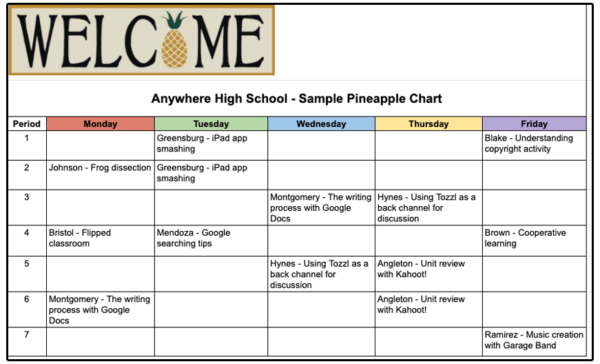
If, for example, you were going to use Kahoot! as a review tool in your third-period U. S. History class, you would put that on the chart. Or if you were going to have your ESL students discuss the theme of solitude using the Fishbowl technique, you would add it to the chart. Your peers can regularly check and see topics or techniques that they are interested in learning more about that fit their conference period and then stop by. If the lesson is not happening during a time when they can observe, they can set up a time to talk with you about the lesson and still benefit from your expertise.
Benefits of Pineapple Charts
With a pineapple chart and teachers willing to learn from each other, your campus can experience a greater breadth of knowledge and outstanding teaching, as well as collaborative growth. And it provides a much-needed opportunity for amazing educators to shine. You can extend the learning by asking those who watch the lesson to provide feedback, something simple like one thing that really worked for students in the lesson and one way to improve it. It’s a win/win for everyone involved.
Making Pineapple Charts Work on Your Campus
The amazing Jennifer Gonzalez has more information on pineapple charts in her blog “How Pineapple Charts Revolutionize Professional Development.” She provides some tried and true techniques to ensure that they are successful, including ways to find and make time for teachers to visit and learn from each other. And she includes great examples from two schools who are using the pineapple chart process on a regular basis to improve teaching and learning. Be sure to also read the comments section where she answers other questions about this innovative technique.
This post was updated with new information on February 26, 2021.

 What Is Flip?
 Students begin learning observational skills in science starting in kindergarten. Though the skill is not as robust or refined as what a high school student may demonstrate, there is still great value in having them engage in observing the world around them to start taking notice of how things work. Observation is a foundational science skill that leads to communication, classification, measurement, inferencing, and predictions.
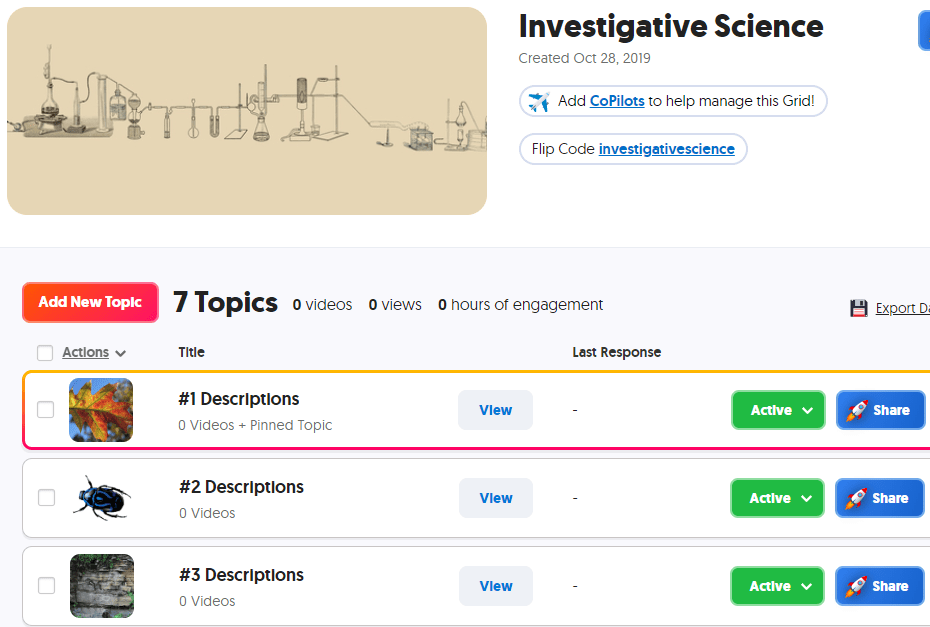 In Flip, create a grid for observations. Each topic in this grid will show a photo or video that the student is to observe and describe. Depending on the level of skill, you can require students to use previously learned vocabulary in their responses. If you want students to use words from a given word bank that you have developed for them, create the document and add it as a topic attachment to the topic. You can reference this word bank in multiple topics by adding the link to each topic. If you have a rubric to guide the students in their work, add the rubric as another topic attachment; for younger students, you may need to record a video showing the rubric while you are reading it aloud.
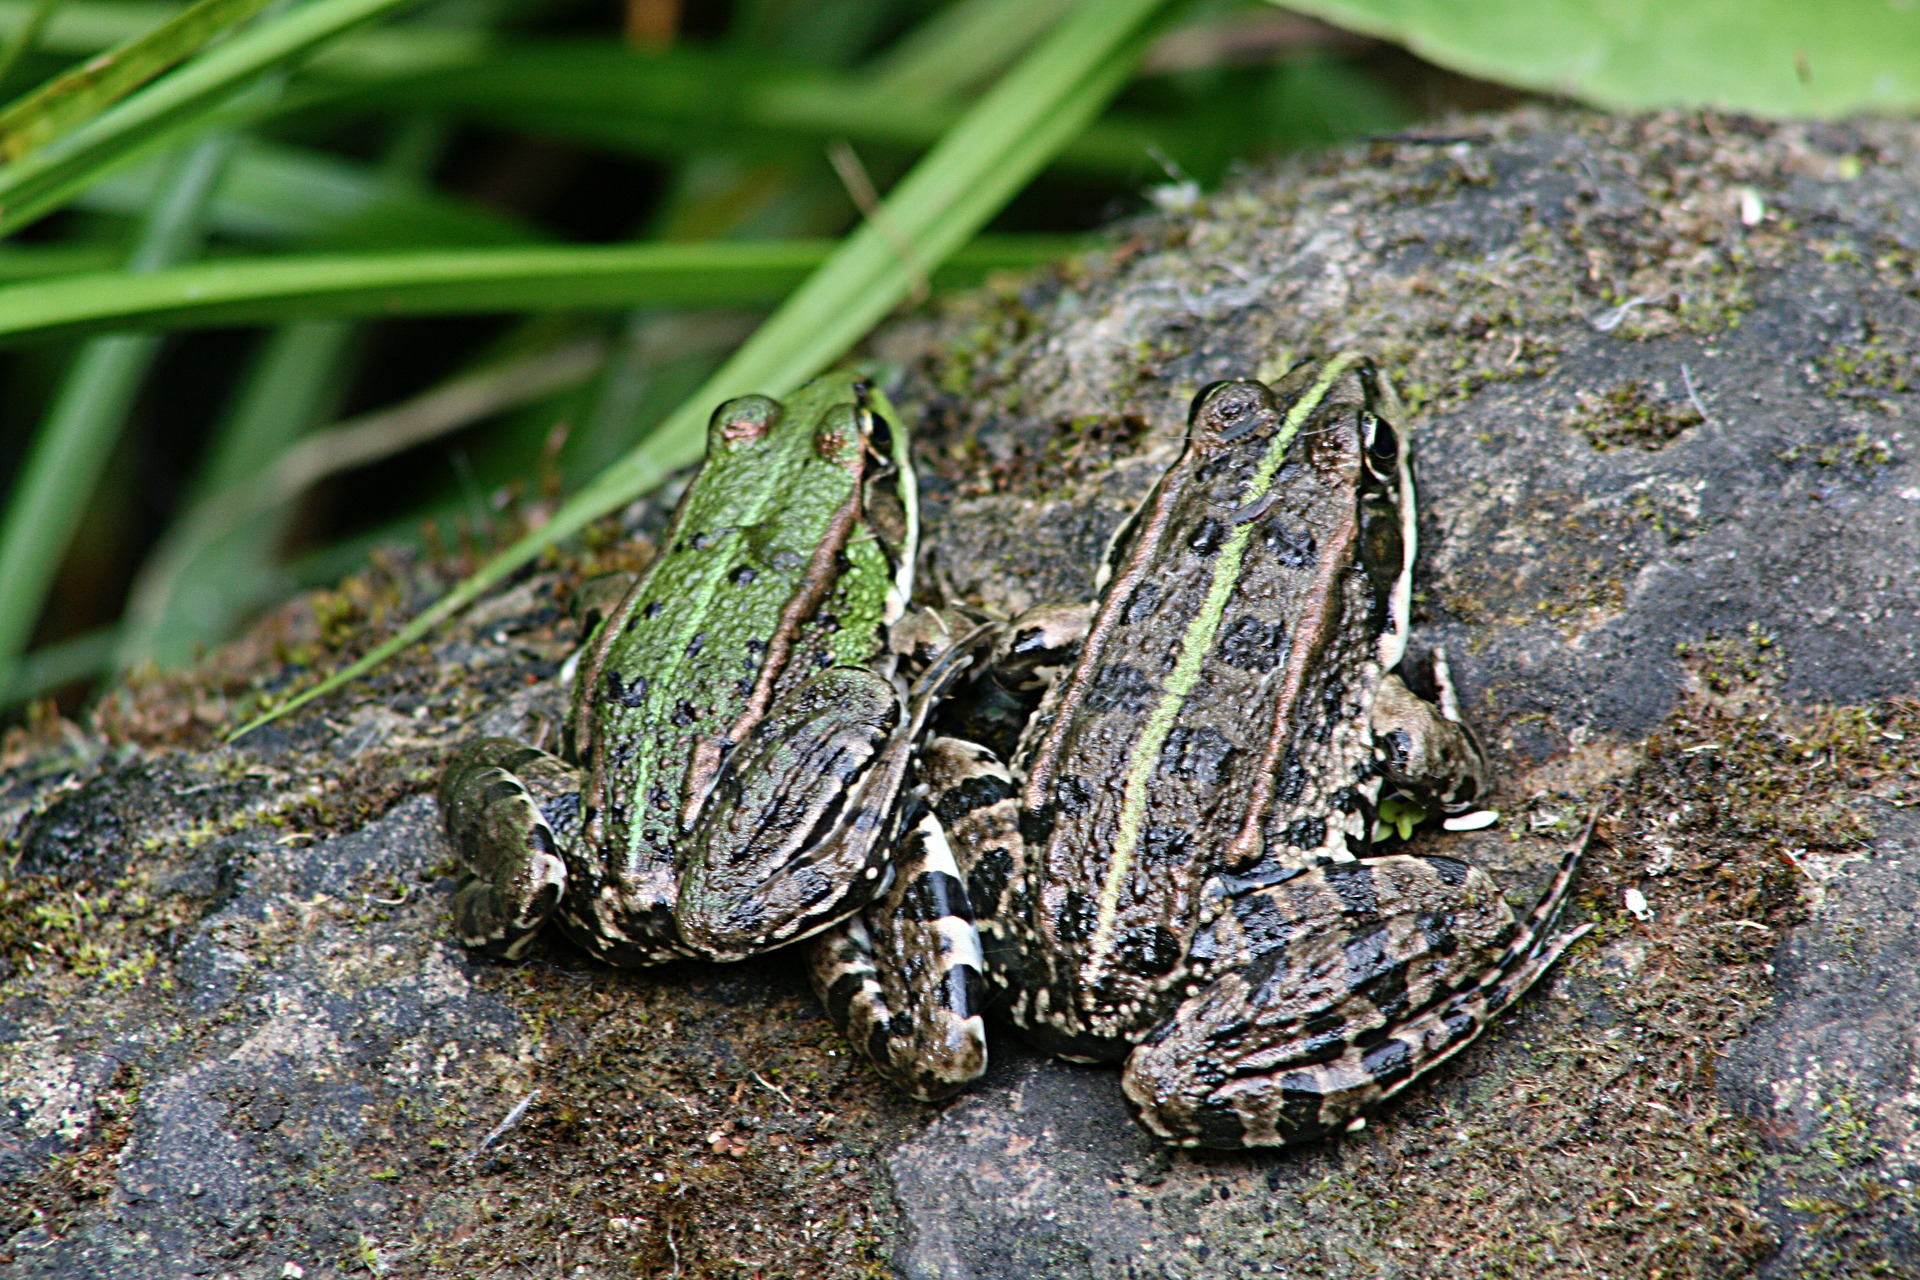 Go to
Go to 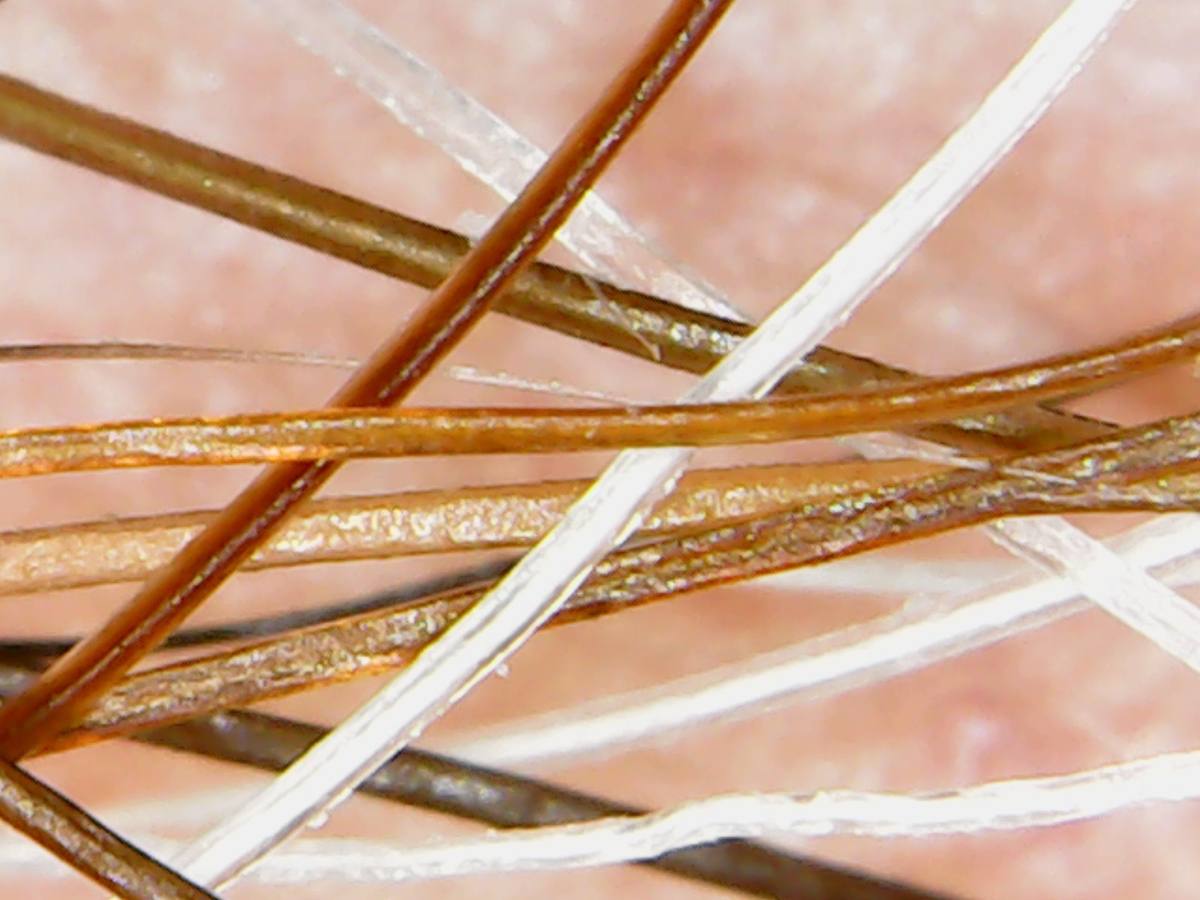 Begin by creating a grid to hold your inferencing topics. As done above, create a standard set of instructions for your students. You can go to ,
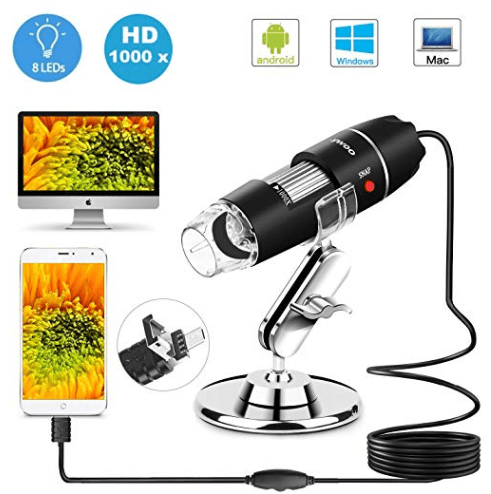 USB Microscope – Consider purchasing a USB microscope that you can connect to your device in order to take photos and videos of actual materials in your classroom…or on fieldtrips! Read the details carefully as some microscopes will work with some devices but not all…such as Android phones/tables, PC computers, and Mac computers but not iPhones or iPads. If you need a microscope that connects with your iPhone or iPad, be sure that it explicitly states that it connects. Likewise if you are wanting to connect the microscope to a Chromebook. If it is not clearly stated, look for a link in which you can ask the seller or locate that microscope on another seller’s website to see what information they provide.