

Have you ever wondered who’s accessing digital resources in your schools? What they’re accessing? How much learning time is spent using each instructional resource? If you’re getting a return on your digital resource investments? If you have, ClassLink Analytics is for you!
ClassLink Analytics has all the answers to your digital resource usage questions! It now features a fresh look, more report options, and added functionality. Click on the “New Analytics” button in the left navigation to check it out.
Explore the latest ClassLink Analytics Features
Measure Time Spent Learning
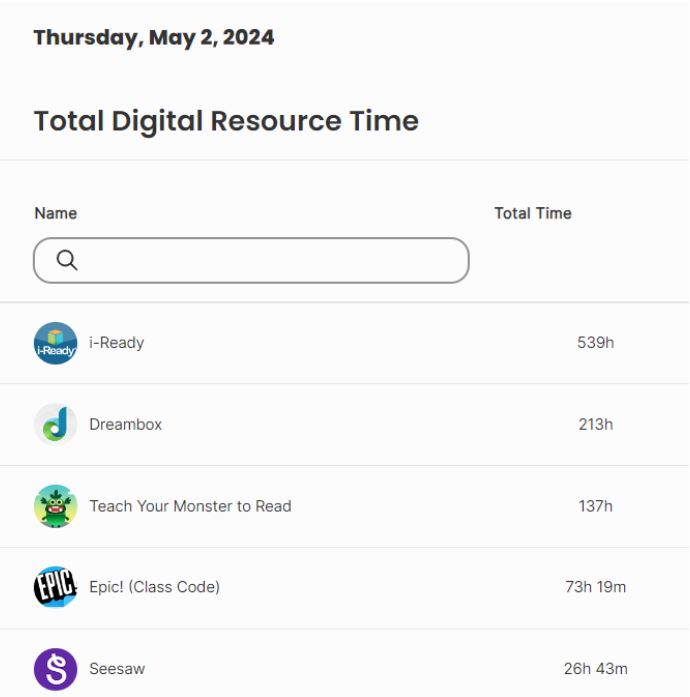
Go beyond tracking clicks and experience usage analytics like never before. Now, prioritized reporting offers data on how much time students spend using each resource daily or over any time period you choose at the district, school, and student levels. Want to know which resources students use the most? Check out our Digital Resources report under the Usage Table.
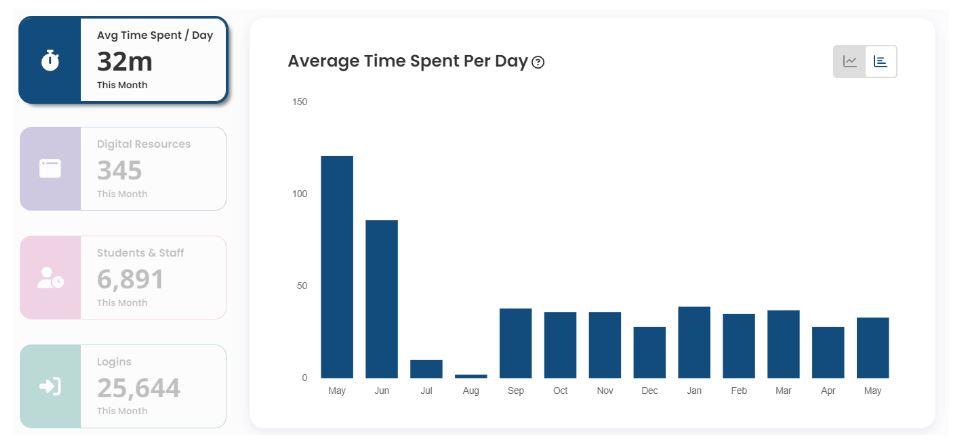
With Analytics+, time calculations include time spent in digital resources accessed within My Apps and when students or staff go directly to a website on a school-owned device.
Group Applications Together to Analyze Product Usage
Do you have multiple applications in ClassLink Launchpad that represent the same product? You may have an application that requires you to set up one instance per school or multiple resources from the same vendor.
Now, in Analytics, you can gather all product or vendor data together using our Application Groupings data type. This allows for a comprehensive analysis of time spent across a product and the ability to do a comprehensive cost analysis. To create a group, select the applications you wish to analyze collectively and hit the “Quick Merge” button. You will see your group under the Apps+ Type.
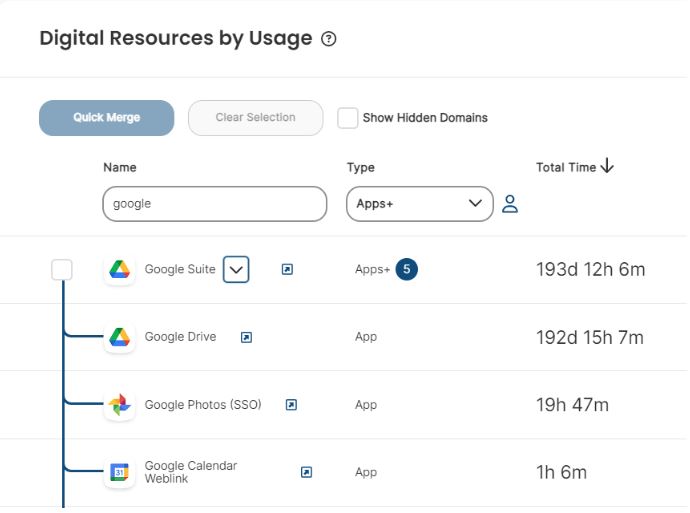
With Analytics+, you collect data on all websites your students and staff access on school devices. This domain data is a powerful addition to your application groupings, allowing you to feel confident that all usage data is captured in your analyses.
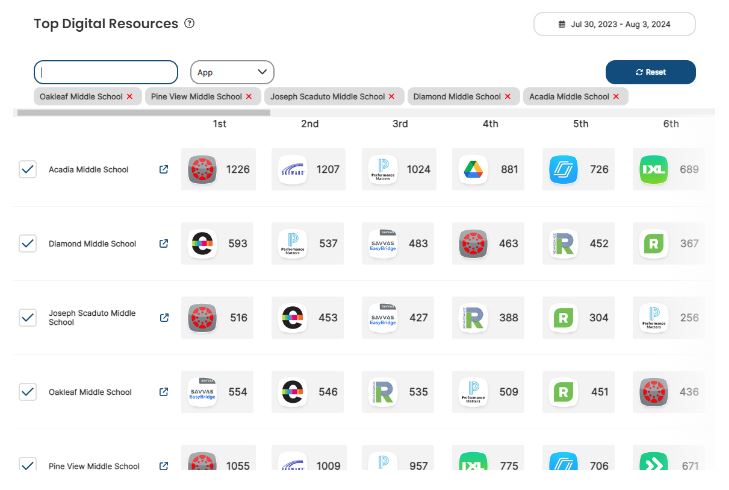
Compare Across Buildings with New School Comparison Reports
Using the new school comparison reports, you can easily compare key metrics across your schools. In our new module, you decide which metric to analyze—logins, time, digital resources, or users. Next, select which schools to compare.
With Analytics+, you can compare the usage of all digital resources, including websites accessed outside of ClassLink. You also gain grade-level comparison reports.
The new look and feel of ClassLink Analytics makes it easier than ever to gain insight into using digital resources in your schools. With reports focused on time spent on digital learning, enhanced school comparison reports, and the ability to group applications together, Analytics increases your ability to make informed decisions about your digital ecosystem.
Still looking for answers to questions like student usage of generative AI and usage data for resources accessed directly from your LMS? Need more insight into the resources used in classrooms to ensure all the proper security policies are in place? With Analytics+, you get all the new and improved reports plus answers to the questions above!
Learn to tell your data story at CLAS 2024—ClassLink’s FREE annual Learning Analytics Summit! Register today!
Want to share your data best practices? Submit your CLAS 2024 session proposal here.