

If you know me at all, then you know that I’m a sucker for maps. There’s something magical about visualizing places and data in a spatial way. That’s why PamPam’s AI Map Generator fascinates me. And, after playing around with it, you may develop the same obsession.
What Is PamPam’s AI Map Generator?
PamPam is a platform for creating custom, interactive maps. You can sign in with your Google Workspace for Education account. Their AI Map Generator takes the process to a whole new level. According to their website, it allows you to “Create maps in seconds with AI.”
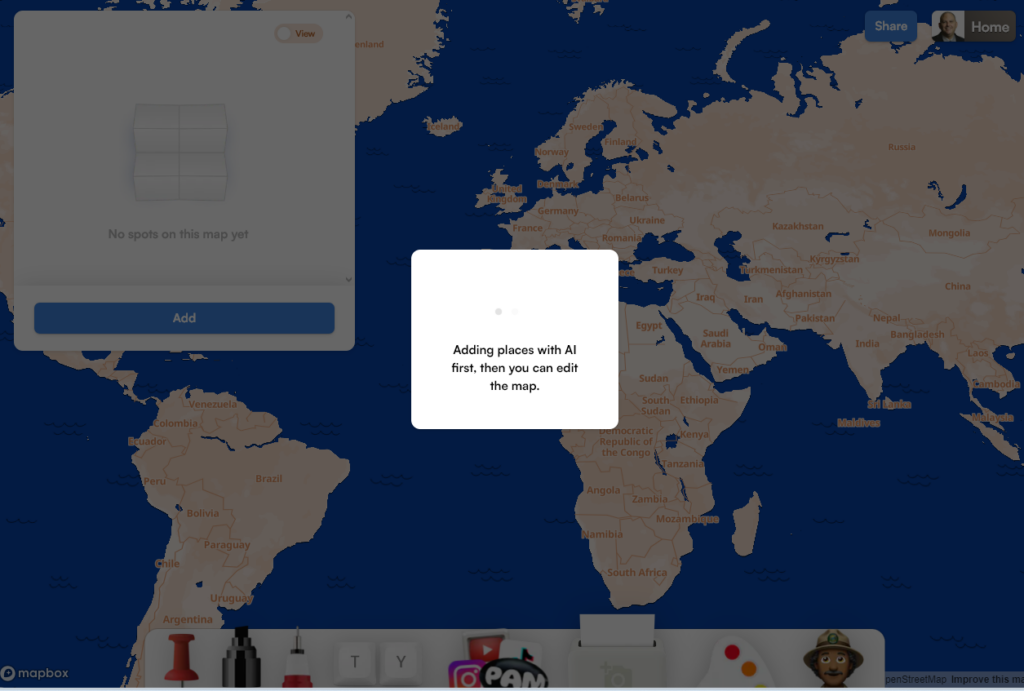
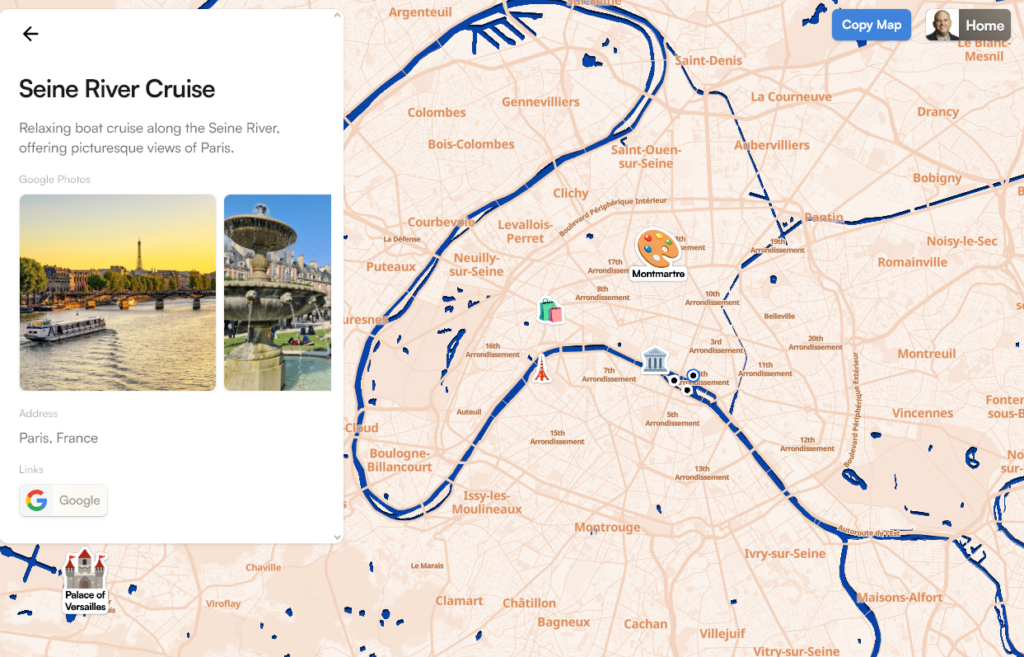
The idea is that you can describe what kind of map you want. Then, the AI makes it for you. It will include relevant points of interest. Once you go to the AI Map Generator page, you’re presented with a simple prompt box. You can type in something like “Historical sites in Rome” (or Texas) and the AI gets to work. In a few seconds, you have a custom map. The map comes with pins for relevant locations and brief descriptions.
What’s more, there is a wealth of templates you can take advantage of. Some of the categories include:
- Public art walk
- Bucket list
- Event calendar
- City guide
While this is not necessarily an educator-friendly website, it’s probably a must-have for those who are missing Google Tours (which Google shuttered in 2021). You might also compare it to these other solutions.
Comparing Map Solutions
Here are a few map solutions you can compare to PamPam. No doubt, there are others. TCEA has featured StoryMap previously.
| Feature | PamPam | Historypin | National Geographic Resources | StoryMap |
|---|---|---|---|---|
| User-generated content | Yes – users can create and share their own maps | Yes – users can upload images and anecdotes | Limited – mostly curated content | Yes – users create their own stories |
| Geographical focus | Yes – allows users to create and share location-based content | Yes – content tied to specific locations | Yes – global focus | Yes – map-based storytelling |
| Educational resources | Limited – focused on user-created content | Limited | Extensive – lesson plans, interactive content | Limited – focused on storytelling |
| Timeline functionality | Not apparent | Yes – can explore content by date | Some – in specific resources | Yes – can create sequential narratives |
| Mapping interface | Yes – custom interface | Yes – uses Google Maps | Yes – uses National Geographic maps | Yes – uses ArcGIS maps |
| Mobile app | Yes – web app accessible on mobile devices | Discontinued | Yes | Yes |
| Collaboration features | Yes – users can share maps and collaborate | Yes – users can contribute to others’ collections | Limited | Limited |
| Multimedia integration | Photos, text, video, links | Photos, videos, audio | Photos, videos, interactive elements | Photos, videos, audio, web content |
| Customization options | Yes – users can create custom maps and add various elements | Limited | Limited | Extensive – themes, layouts, fonts |
| Target audience | General public, travelers, businesses | General public, historians | Educators, students, general public | Storytellers, organizations, educators |
| Unique features | Ability to create custom maps with various elements like routes, areas, and points of interest | Historical focus | Professionally curated educational content | Advanced storytelling features with map integration |
Let’s take a look at some ways you might use this in the classroom aligned to the relevant Texas Essential Knowledge and Skills (TEKS) content area.
Ways to Use This AI Map Generator
This tool opens up so many possibilities for creating useful, interactive maps. Here is an AI-generated list of ideas matched to relevant TEKS content area and standard. You can drop the prompt into an AI tool (e.g. ChatGPT, Claude, Perplexity) to get a CSV file you can import into PamPam, or Google Sheets first then import into PamPam.
| AI Map Generating Idea | Relevant TEKS Content Area and Standard | Prompt to Generate AI Map Idea |
|---|---|---|
| Create interactive historical maps for Texas history lessons | Social Studies – Grade 7 (Texas History) 7.6(A) Identify significant events and issues, including expansion of the Texas frontier | Generate an interactive map of Texas showing key historical events and frontier expansion from 1821 to 1900. Include major battles, settlements, and territorial changes. For each point on the map, provide a CSV file with columns for title, address, description, and a link to a relevant video (if available). |
| Map out ecosystems and habitats for science units | Science – Grade 7 7.10(A) Observe and describe how different environments support different varieties of organisms | Create a detailed map of Texas showcasing various ecosystems and habitats. Highlight the diversity of organisms in each environment, including deserts, forests, wetlands, and coastal areas. Provide a CSV file with columns for title, address, description of each ecosystem/habitat, and a link to an educational video about the ecosystem (if available). |
| Visualize mathematical concepts like area and distance | Mathematics – Grade 6 6.8(D) Determine solutions for problems involving the area of rectangles, parallelograms, trapezoids, and triangles | Design an interactive map of a fictional town with various shaped plots of land. Include rectangles, parallelograms, trapezoids, and triangles. Provide measurements for sides and angles to allow area calculations. Generate a CSV file with columns for title (shape name), address (coordinates on the map), description (including measurements), and a link to a video explaining how to calculate the area (if available). |
| Plot settings from literature for English classes | English Language Arts and Reading – Grade 8 8.5(D) Analyze how the setting influences the theme | Create a map depicting the key locations in a chosen novel, such as “To Kill a Mockingbird”. Include important landmarks and areas that influence the story’s themes and character development. Provide a CSV file with columns for title (location name), address (if applicable or fictional coordinates), description of the location’s significance, and a link to a video analysis of the setting (if available). |
| Design virtual field trips to explore different cultures | Social Studies – Grade 6 (World Cultures) 6.15(A) Identify and describe factors that influence cultural change | Generate an interactive world map highlighting five diverse cultures. For each, include key locations, cultural landmarks, and brief descriptions of factors influencing cultural changes. Create a CSV file with columns for title (culture/landmark name), address, description of cultural significance, and a link to a virtual tour video (if available). |
| Map local community resources for social studies projects | Social Studies – Grade 3 3.4(D) Identify the characteristics of different communities, including urban, suburban, and rural | Create a detailed map of a local area showing urban, suburban, and rural zones. Include community resources such as schools, parks, hospitals, and government buildings in each zone. Provide a CSV file with columns for title (resource name), address, description of the resource’s function, and a link to a video tour or explanation of the resource’s role in the community (if available). |
| Illustrate geographical features for earth science lessons | Science – High School Earth Systems EARTH.11.D Interpret Earth surface features using satellite imagery, aerial photography, and topographic and geologic maps | Design a comprehensive map showcasing various geographical features including mountains, valleys, rivers, and coastal areas. Incorporate layers for satellite imagery, topography, and geological information. Generate a CSV file with columns for title (feature name), address (coordinates), description of the geographical feature, and a link to an educational video about the feature’s formation or characteristics (if available). |
| Create data visualizations for statistics and analysis | Mathematics – Grade 8 8.11(A) Construct a scatterplot and describe the observed data to address questions of association | Generate a map of Texas showing population density by county. Include a scatterplot comparing population density to average income, with each point representing a county. Provide a CSV file with columns for title (county name), address (county seat or coordinates), description (including population density and average income data), and a link to a video explaining how to interpret scatterplots (if available). |
| Plan hypothetical city layouts for urban planning units | Social Studies – High School Economics TEKS (specific standard not provided in search results) | Design a map of a hypothetical city with distinct zones for residential, commercial, industrial, and recreational areas. Include transportation networks and key infrastructure elements. Create a CSV file with columns for title (zone/area name), address (coordinates on the map), description of the zone’s purpose and features, and a link to a video about urban planning principles (if available). |
| Map migration patterns for biology or social studies | Science – High School Biology Bio.12(F) Analyze and evaluate how natural selection produces change in populations | Create an interactive world map showing the migration patterns of a specific animal species over time. Highlight environmental factors influencing these patterns and how they relate to natural selection. Provide a CSV file with columns for title (location name or migration stage), address (coordinates), description of the location’s significance in the migration pattern, and a link to a video showing the animal’s migration (if available). |
The AI does the heavy lifting of finding and plotting relevant locations. Here’s what the result might look like in Claude.ai:
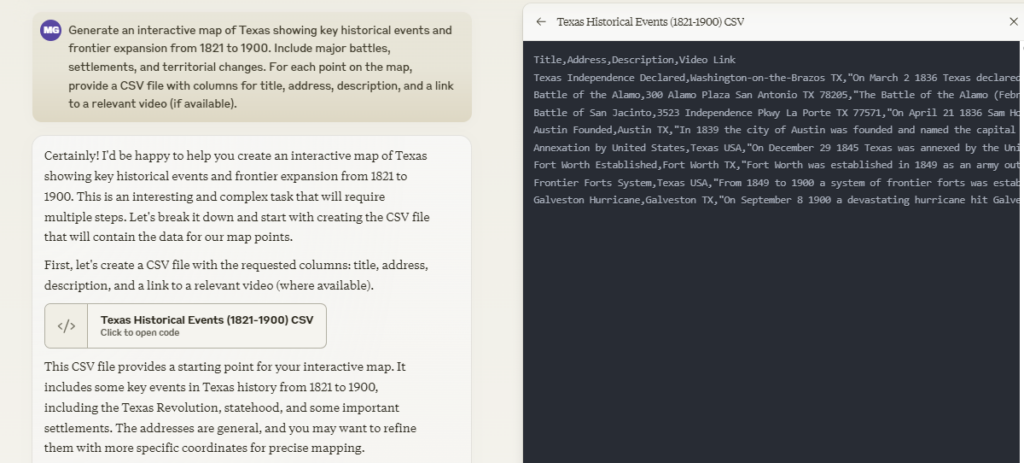
You can see in the screenshot above how Claude takes the provided prompt, then generates a CSV file on the right-side. Once the CSV has been saved to your device, you can import into PamPam:
Customizing the Map
You can even customize the maps further. Use the toolbar at the bottom to add links, pins, and more:

What is great about PamPam’s tool is how it makes creating rich, informative maps so easy. You don’t need to be a GIS expert or spend hours researching. You can get a solid starting point in seconds. As with any AI tool, you will want to verify selections. That aside, you have a great starting point.
Making a Map
Ready to make a map? You can find a wealth of tutorials online via the PamPam YouTube channel. To add items, click the ADD button:
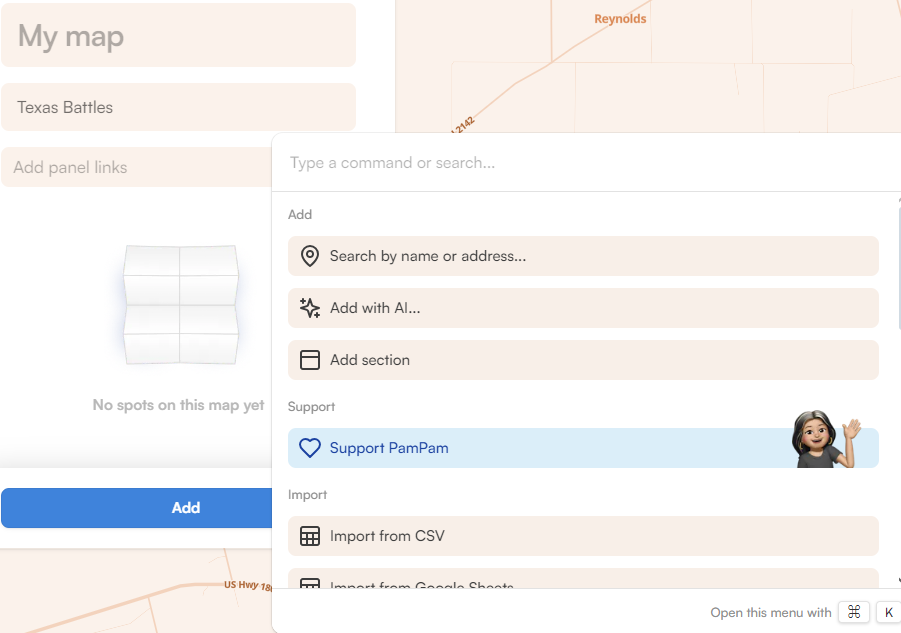
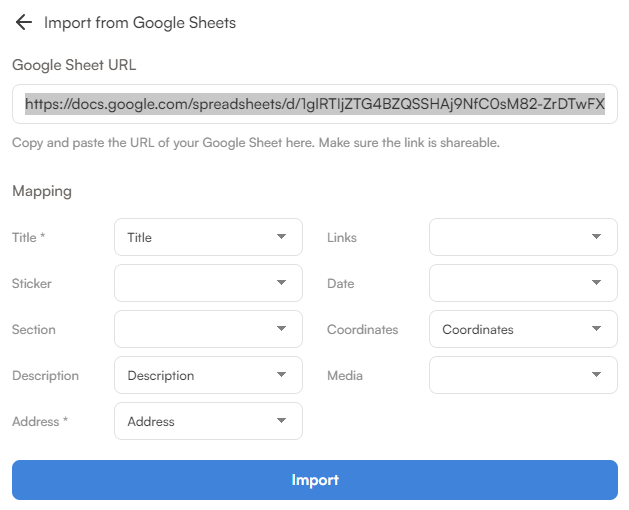
Clicking the ADD button will give you several different ways to import content, including CSV, Google Sheets, Google MyMaps, Airtable, text, and link. You will need to format your CSV data file or Google Sheets columns using these column headers:
- Title*
- Sticker
- Section
- Description
- Coordinates
- Address*
- Links
- Date
- Media
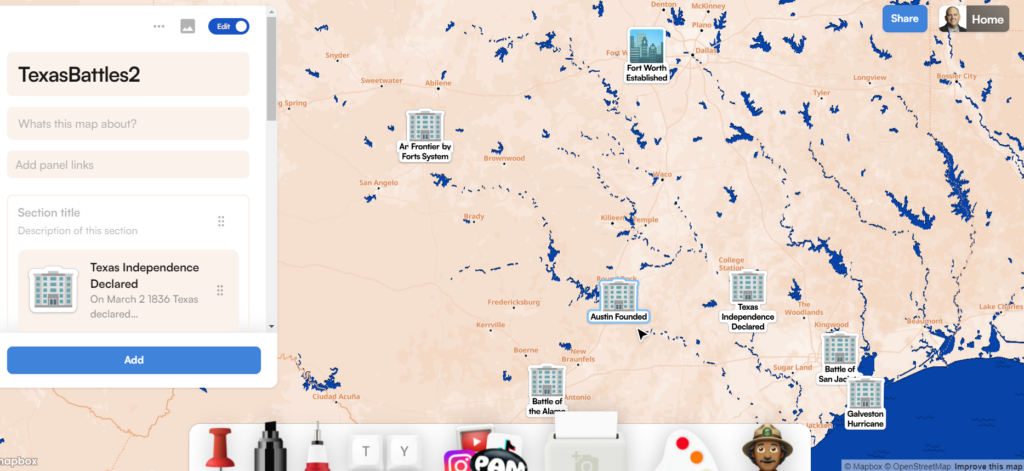
As many items as that seems, only title and address are required. In the example below, I relied on Google Sheets import. It worked well (see my source Sheets document):
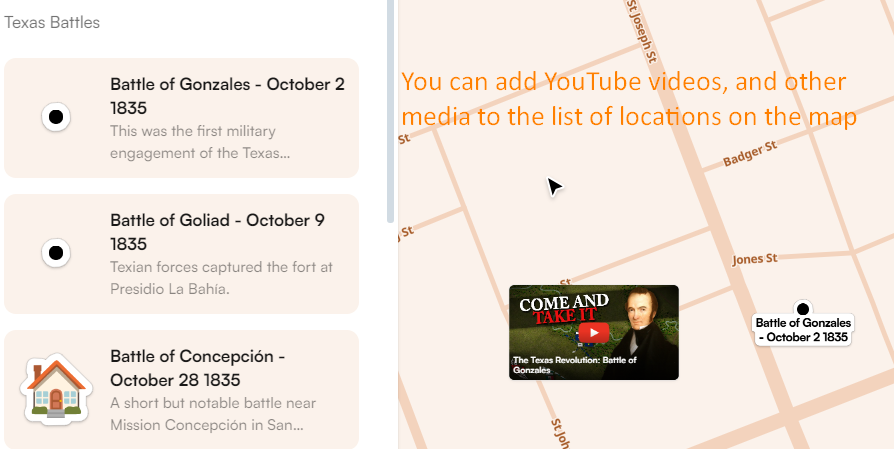
Once the list of locations is imported, you are able to begin customizing content and adding to it. You can see the video I added for the Battle of Gonzalez below:
When you are ready to share your map, you can do so, even allowing copies to be made:

How Much It Costs
You may be wondering, “How much does PamPam cost?” Refer to their pricing guide for $0, $5, or $29 per month pricing. With the free account, I was able to create several maps as I explored various options. I did experience some issues with CSV import but PamPam had no issues with the Claude.ai generated CSV file. On review, the $0 per month Guest view does NOT support CSV. I do wish there was an educator level account that allowed for a little more support and enjoyed K-12 friendly templates.
Give AI Map Generation a Try
Take a minute to try it out. It will save you time, spark your creativity, and help you visualize information in new ways. Who knows what kind of maps you might create?
4 comments
Great review on a great tool! I feature PamPam in the AI Tools & Uses for History and Social Studies Teachers chapter of my new book: AI Tools & Uses: A Practical Guide For Teachers: https://www.amazon.com/AI-Tools-Uses-Practical-Educators-ebook/dp/B0D9SX22WW/. Would love your feedback, Miguel.
Tom, how awesome! I picked up a copy via Kindle Unlimited, and I’m reading the intro now. This was quite intriguing:
I’m looking forward to reading the whole book and have it on my device. Thanks for making me aware of it, and wishing you all the best, Tom.
Regards,
Miguel
Great blog post Miguel!! This former history and geography teacher approves! This current Bible teacher/pastor sees this as a possible tool to create my own Bible maps! As usual you’ve given me much to think about!!
Oh, you’re too kind, Jennifer. I hope you’ll share some of those maps you make, and how, with us for illumination.
😉
Regards,
Miguel