As a third grade teacher, I loved having my students collect data to graph. At the time, they relied on age-appropriate graphing tools like Labs for Learning’s LabQuest and Tom Snyder’s The Graph Club. Today, there is still ample data available to collect and organize. Let me introduce you to a new graphing and calculator tool you may find useful.
Finding free graphing tools is something I’ve spent time doing, but more recently, I decided to vibe-code my own, Gen AI-free tools. That’s right, the tool I’m featuring in this blog entry does not have any Gen AI components, works in your web browser (great for Chromebooks, Windows, and Macs), and probably works fine on iPads, too. What’s more, it’s multilingual, Texas Data Protection Agreement friendly, and collects NO data. They can use it at home or at school for free. And, no advertising pop-ups or banners.
Data Collection
Students collect plenty of data in school. They measure plants, survey classmates, track temperatures, plot ordered pairs, and look for patterns. Too often, though, the graph at the end is something the teacher makes.
GraphSplat puts students behind the data.
GraphSplat is a free, browser-based graphing studio from DrawSplat.org. Students can create the following without creating an account:
- charts,
- picture graphs,
- coordinate plots,
- function graphs,
- geometry models, and
- specialty visualizations
What’s more, data and uploaded images stay in the browser.
Here are seven ways to put it in students’ hands. Let’s go through each:
1. Graph Your Class
Have students survey classmates about favorite books, pets, school subjects, or ways they get to school.
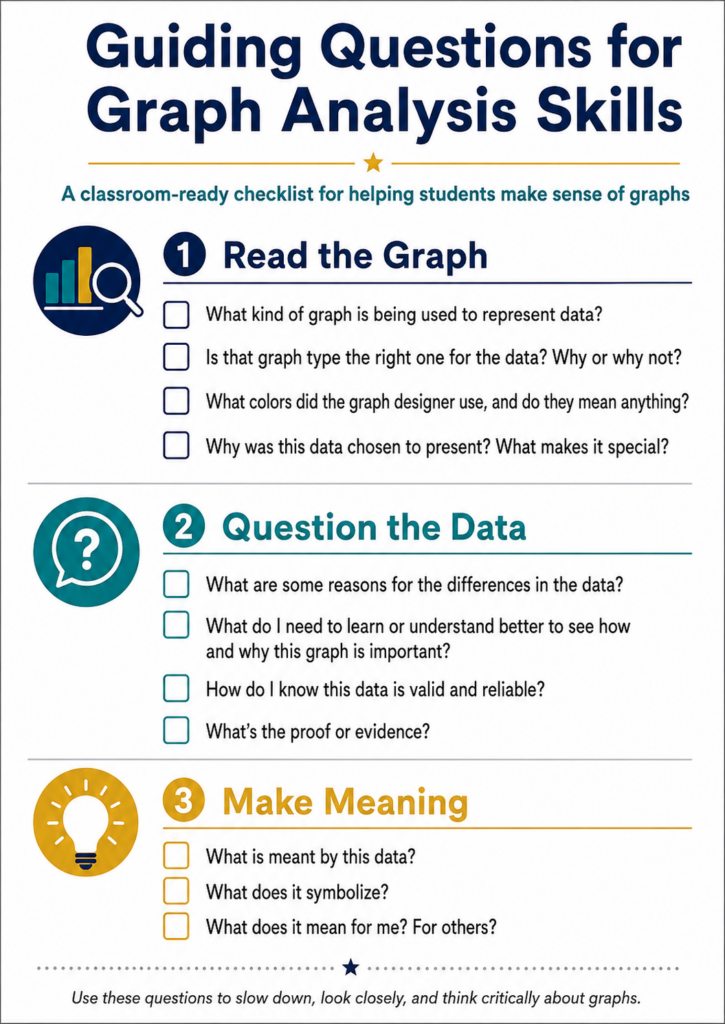
Then let them decide whether a bar, pie, donut, or another chart best represents the results. The decision about the graph matters as much as entering the numbers.
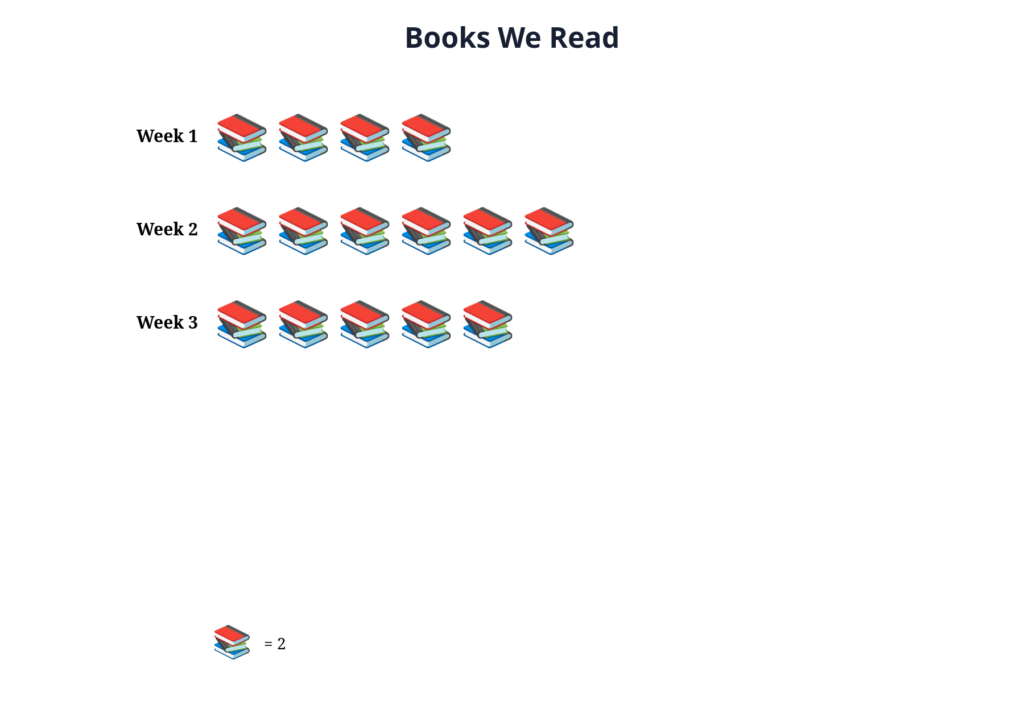
2. Build a Picture Graph
Younger students can turn counts into pictographs using emoji or uploaded pictures.
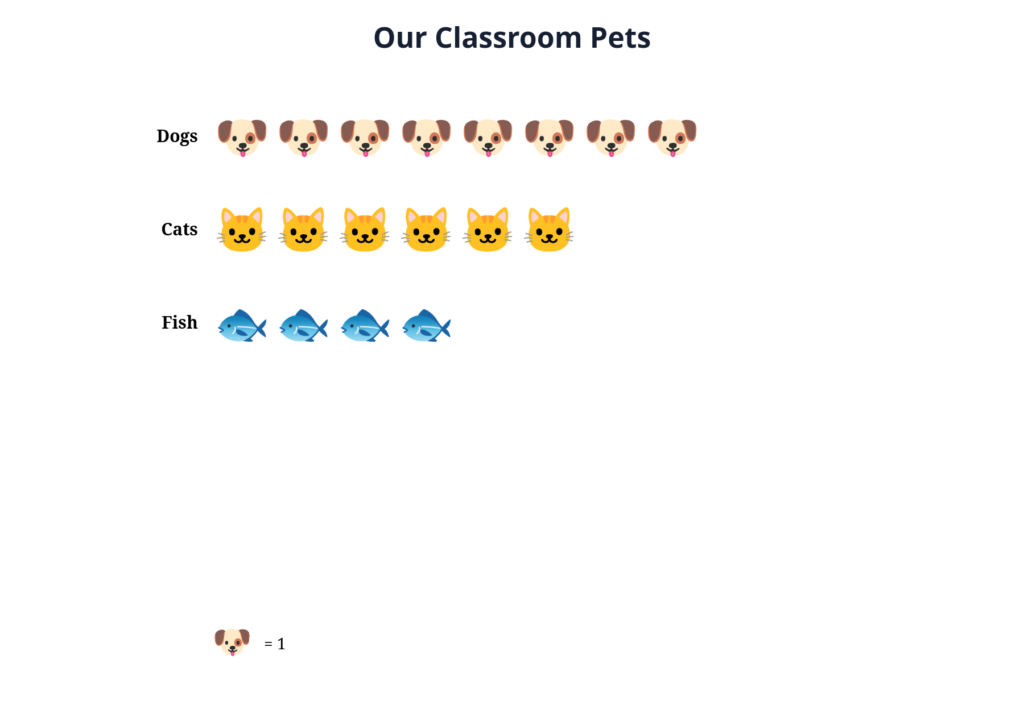
Ask, “If one picture represents two students, what would half a picture mean?” Suddenly, making the graph becomes part of the math.
3. Create a Coordinate Mystery
Give students ordered pairs to plot and connect.
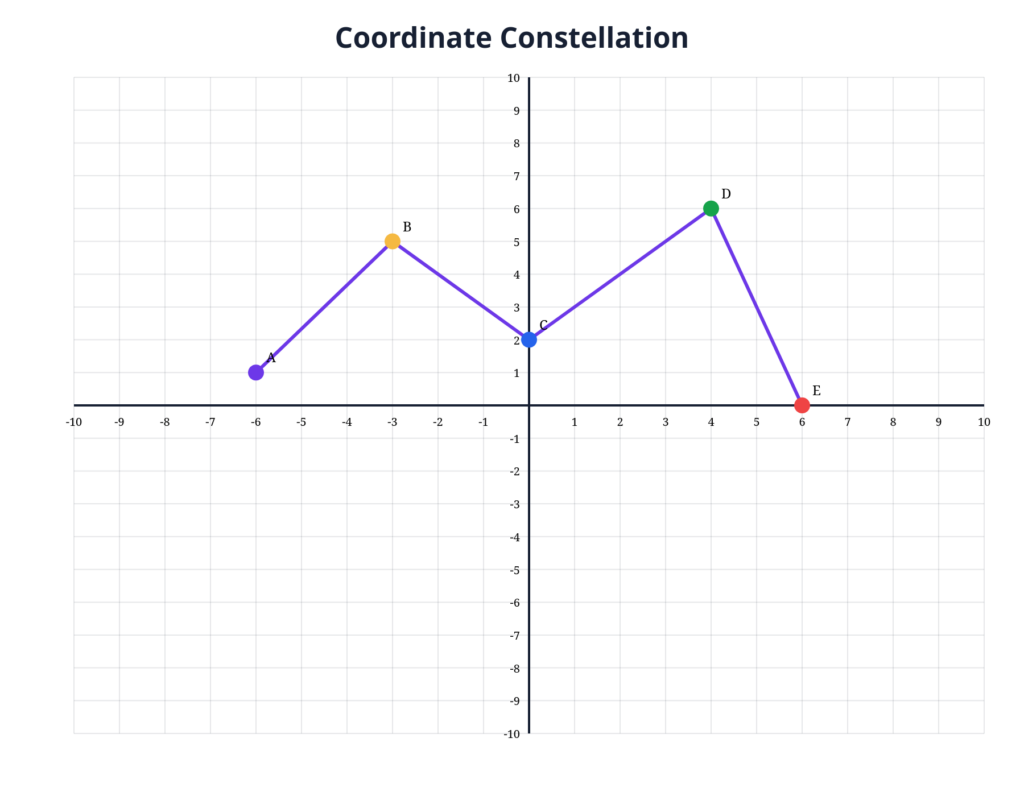
After they discover the mystery shape, have them create their own coordinate puzzle and trade it with a partner.
4. Investigate Moving Geometry
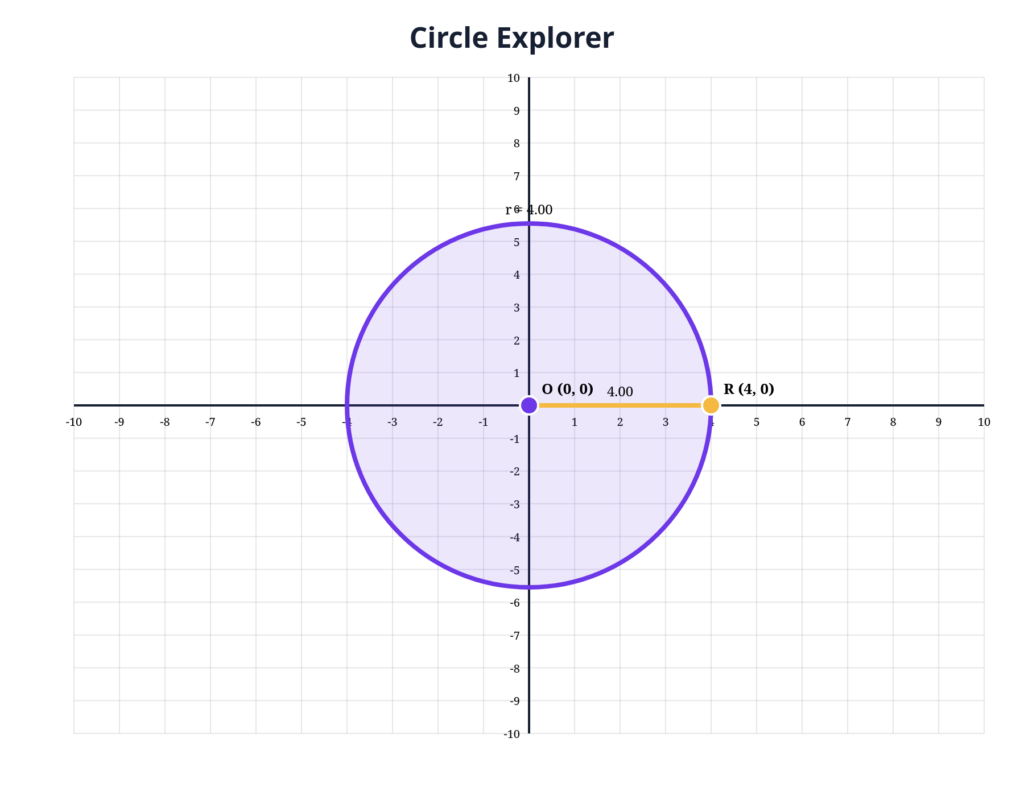
Students can create points, segments, polygons, and circles, then drag them around the coordinate plane.
Have them record a triangle’s area, move one point, and explain what changed and what stayed the same.
5. Make a Function Move
Older students can graph expressions and change variables with sliders.
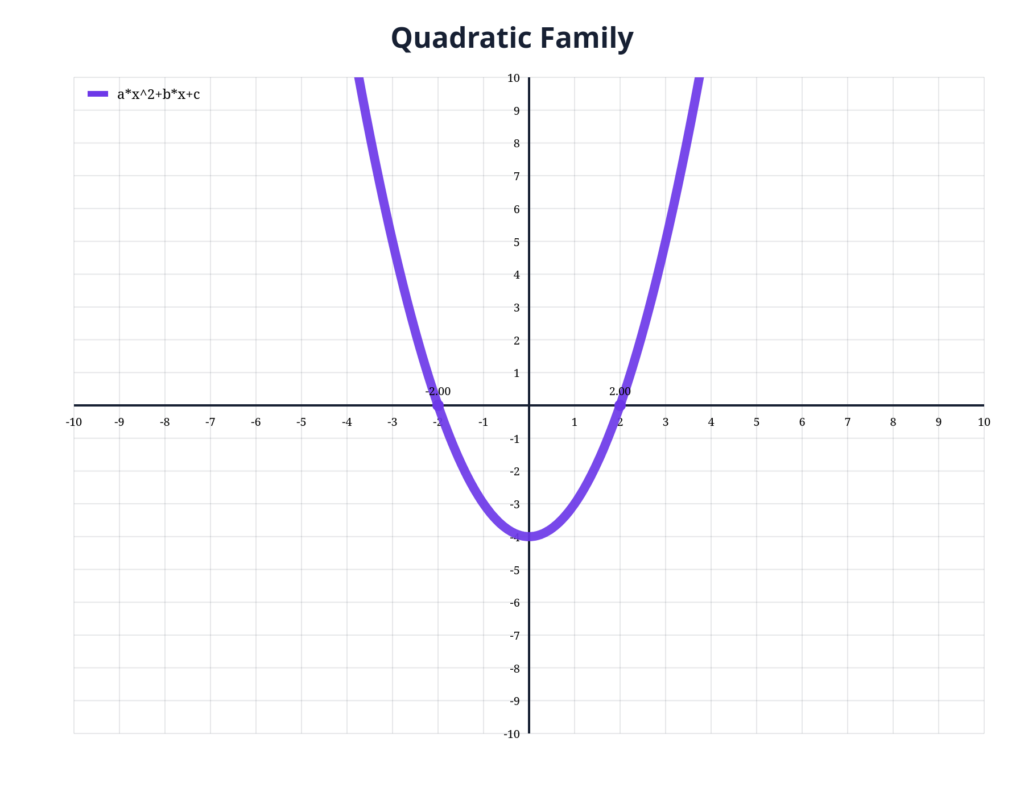
Start with y = ax + b. Have students change a and b, watch the graph respond, and explain the pattern they see.
6. Graph Something You Can Measure
Send students after real data: plant growth, temperatures, reading minutes, basketball shots, or another measurable quantity.
Their job is to collect it, graph it, then write two observations supported by the graph.
7. Become the Graph Designer
Give everyone the same data set but do not tell them which graph to make.
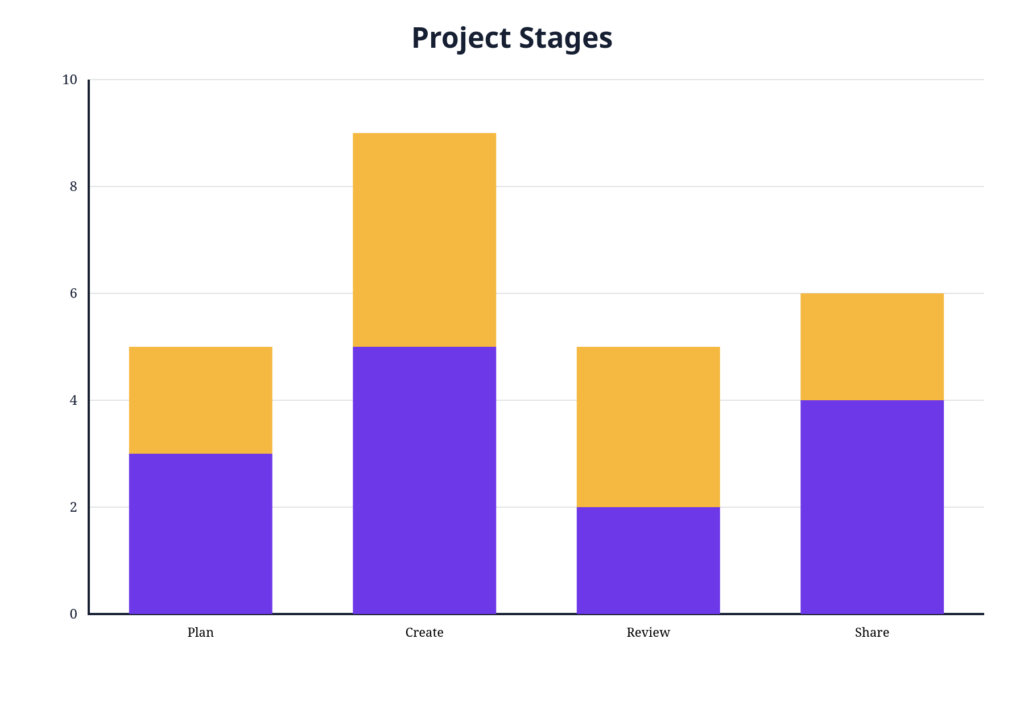
Students choose the visualization and defend their choice. I like this activity because the thinking shifts from “Where do I type the numbers?” to “How should I show these data?”
Start With a GraphSplat Example
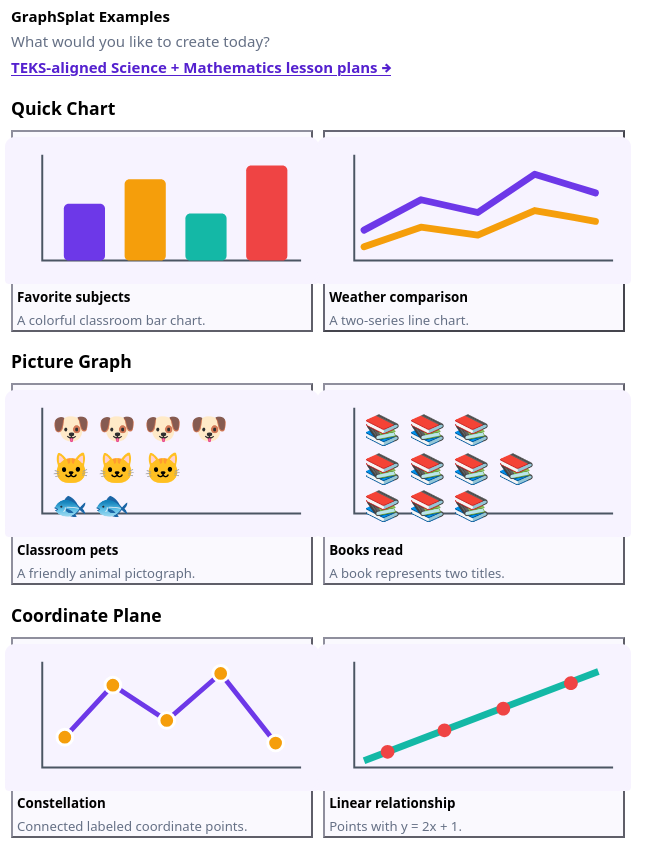
Students do not always need a blank screen. Click Examples at the top of GraphSplat to open the GraphSplat Example Library. It includes ready-to-edit examples for Quick Charts, Picture Graphs, Coordinate Planes, Expression Calculations, Geometry, and Specialty Charts.
Open one, change the data, and see what happens. That makes the examples useful for demonstrations, guided practice, and “notice and wonder” activities before students create their own graphs.
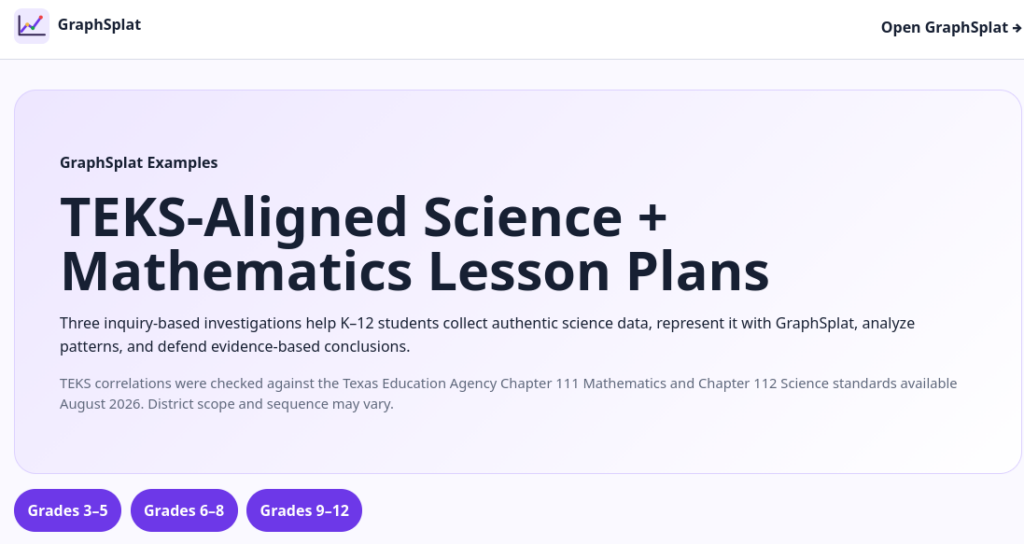
Need a Complete Lesson?
GraphSplat also includes TEKS-Aligned Science and Mathematics Lesson Plans for three grade bands:
- Grades three through five: Schoolyard Biodiversity Snapshot
- Grades six through eight: Campus Microclimate: Shade, Surface, and Temperature
- Grades nine through twelve: Biodiversity and Ecosystem Stability Model
These are investigations, not worksheets. Students collect or analyze data, build graphs in GraphSplat, look for patterns, and defend conclusions with evidence.
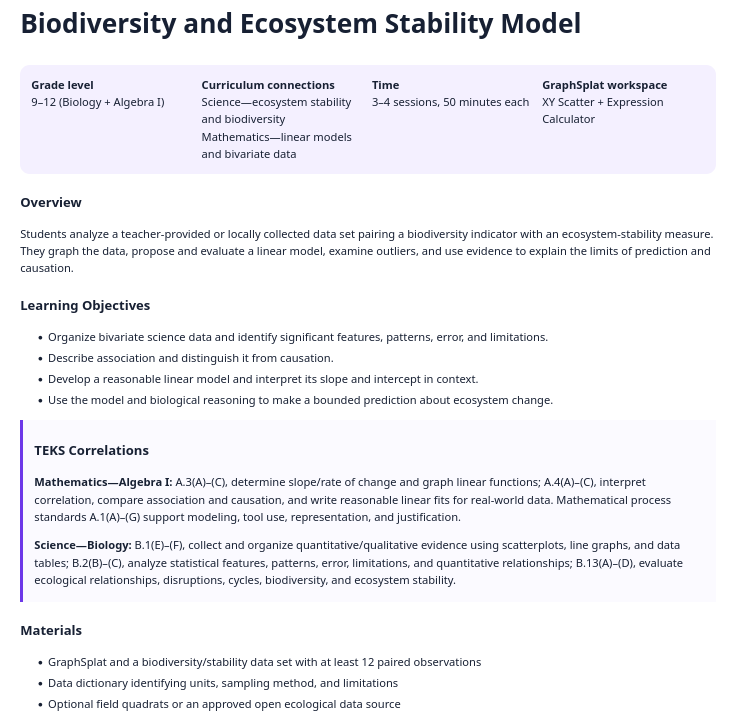
That is where a graphing tool becomes more useful: students are not decorating numbers. They are using data to figure something out.
Open GraphSplat, click Examples for a quick start, or choose a GraphSplat Lesson Plan and put students behind the data.
👤 Human-directed (Miguel Guhlin) · 🤖 Gen AI-assisted (Claude, ChatGPT)