

All over the world, people are longing for a cool breeze to relieve the extreme heat. As school begins, it’s important to learn about extreme heat. It is sobering to think that this summer may be one of the coolest ones that people experience from this point on. If you’re a middle or high school science teacher, or even if you’re not, you may be getting interested in the effects of climate change. Let’s explore some school-friendly resources helpful for educating students, parents, and staff about climate change. Let’s start with some vocabulary, then explore the resources available.
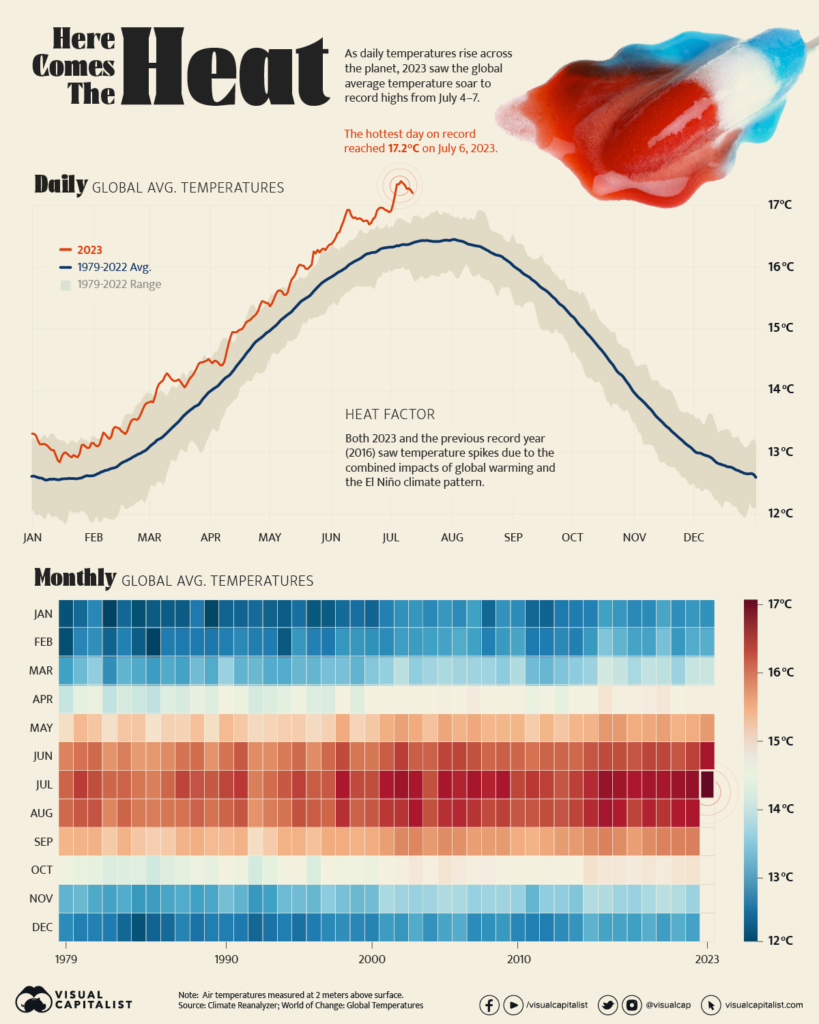
July 2023 was Earth’s hottest month on record by a wide margin. July’s global average temperature of 16.95 degrees Celsius (62.51 degrees Fahrenheit) was a third of a degree Celsius (six-tenths of a degree Fahrenheit) higher than the previous record set in 2019…. “It’s a stunning record and makes it quite clearly the warmest month on Earth in ten thousand years,” said Stefan Rahmstorf, a climate scientist at the Potsdam Institute for Climate Research in Germany.
(source)
Clarifying Vocabulary
Before jumping into a list of resources, it might help to clarify vocabulary. You may have heard about these terms in the news or encountered them in reading. Here are some common vocabulary terms relevant to extreme heat.
- What is Climate Change? This refers to the increase in global temperatures resulting from human-made greenhouse gases. Effects include “loss of sea ice, melting glaciers and ice sheets, and sea level rise.” And, of course, more intensifying waves of heat (source).
- What is the Wet Bulb Globe Temperature (WBGT)? This is a measure of heat stress in direct sunlight. To calculate it, scientists use a complex formula. That formula includes “temperature, humidity, wind speed, sun angle, and cloud cover.” The last, cloud cover, provides insight into solar radiation (source).
- What is a Heat Index? This measures heat stress in the shade. It considers temperature and humidity.
These terms assist us in better understanding how to gauge the heat experienced.
How Extreme Heat Affects Schools
The Summer of 2023 is on track to be Texas’ most extreme with a high number of 100-degree or more days. In June 2023, the temperature went over 100 degrees 250 times. Some school districts are putting heat practices into place to safeguard students.
Consider Dallas ISD’s policy:
Teams can’t practice from noon to 6 p.m. to avoid heat issues. They also take a wet bulb, globe temperature (WBGT) index reading that combines temperature, humidity, wind and cloud cover.
Above 92.1, practice stops. 92.1 isn’t the outdoor temperature or heat index, though. (source)
The heat index and WBGT temperature provide useful information. They assist us in understanding how long one can be outside.
As a K-8 educator, how long can you let kids play outside for recess or P.E.? It all depends on the heat index or wet bulb temperature. This comes down to a student’s sweat not evaporating (and not cooling off their bodies). Computing wet bulb temperature can be difficult, but to make it easier, you can use an online Wet Bulb calculator.
Some examples of wet bulb temperatures dangerous to human life:
Get out of the sun within 30 minutes if the WBGT is…
- 86 (35° C or 95°F with 70% Humidity)
- 85.6 (37° C or 98.6° F with 60% Humidity)
Get out of the sun after 45 minutes if the WBGT is…
- 84.7 (38° C or 100° F with 55% Humidity)
- 85.9 (40° C | 104° F with 50% Humidity)
- 83.5 (42° C | 107.6° F with 40% Humidity)
Weather.gov has a list of suggested actions and impact prevention. For teachers who may be on “outside duty” this summer, it can be quite dangerous for older and immuno-compromised staff as well as for children.
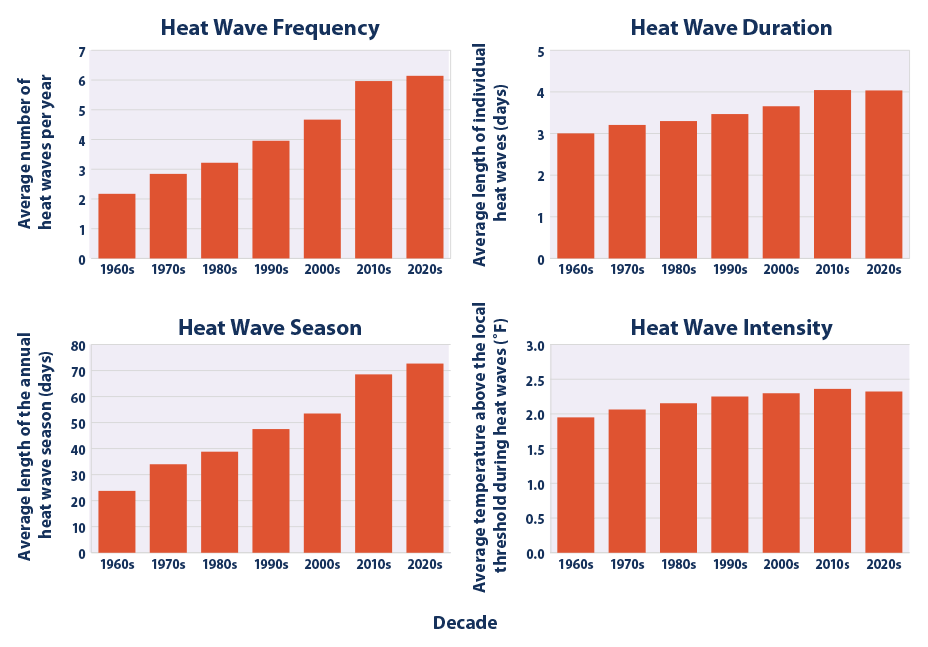
Looking Back at the Data
An often-asked question is, “Was it really this hot back in the 1890s? How about the 1990s?” The answer may surprise you. You can use Weather Spark to see graphs for weather around the country. This set of charts from the Environmental Protection Agency (EPA) shows changes. You can see frequency, duration, season, and intensity:
Let’s take a look at a few resources you may find helpful in your work as an educator. Some are usable with K-12 students.
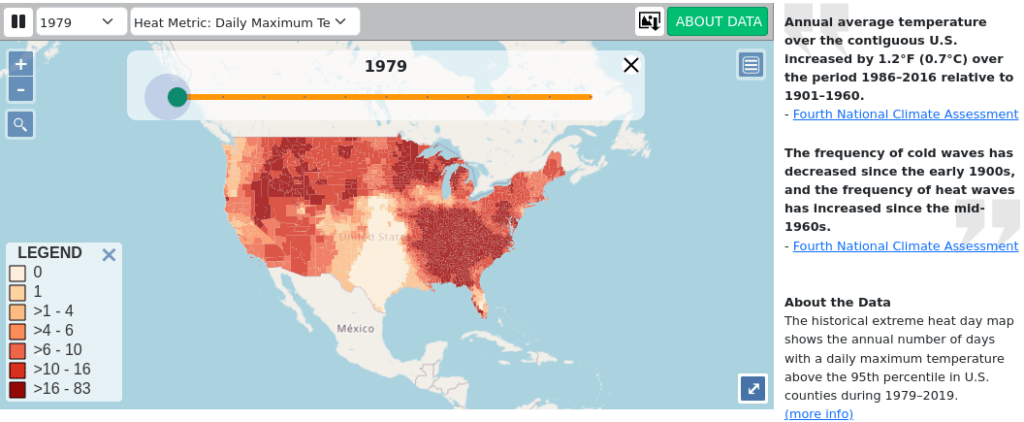
1. Mapping Extreme Heat
President Biden’s HEAT.gov website is a National Integrated Heat Health Information System. You can find a wide variety of heat-tracking tools online. What’s amazing is how many provide learners with access to a way to map the heat. Some tools like the Climate Change Tracker, allow you to enter a zip code and see the heat index:
Here’s a round up of those that provide raw data and graphs you and your grade 6-12 students can use:
- Centers for Disease Control and Prevention (CDC) Heat and Health trackers
- Climate and Health Outlook, Heat.gov
- Climate Prediction Center Probabilistic Extremes, Heat.gov
- Extreme Heat Vulnerability Mapping Tool, Heat.gov
- Heat and Health Tracker, Heat.gov
- National Environmental Public Health Tracking Network
- Climate Change Tracker, Washington Post
- NOAA Climate Data Online
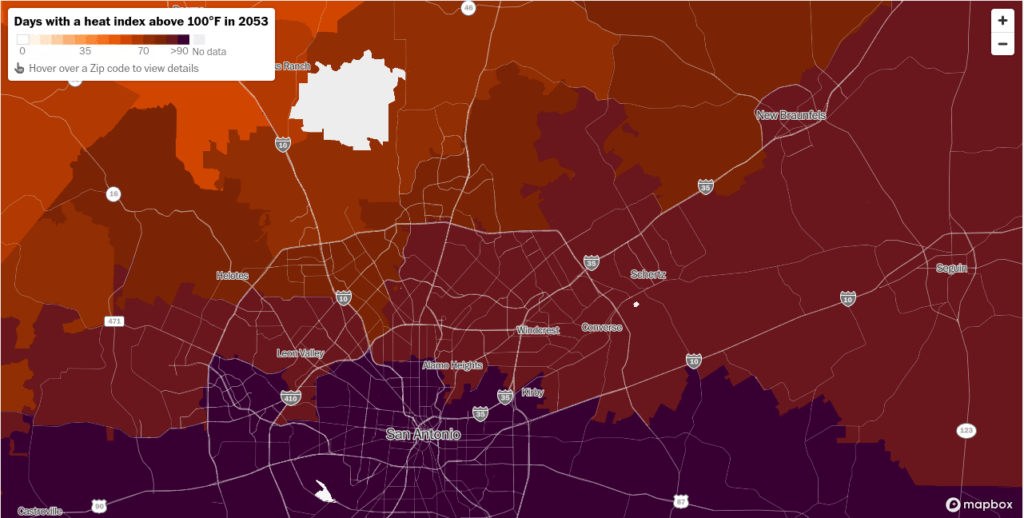
There are many tools available that combine real data with maps. Others offer already-made maps you can view. Scientists update the maps on a regular basis. One example is this interactive map, an EMS Surveillance Heat Tracker (announced 8/9/2023):
As you can see from the map above, you can see how many times emergency services are deployed to assist those affected by extreme heat.
2. Columbia Climate School
The Columbia Climate School offers a series of webinars students can watch. Geared for students in grades 6-12, 8-12, or 9-12, they discuss climate change in easy-to-understand terms. Here are some of their titles:
- Grades 6-12
- Climate Justice in New York City
- Grades 8-12
- Paying Attention to Critical Climate Messages from the Polar Regions
- The Climate Symphony: How Climate Variability Impacts Global Rainfall Patterns
- Grades 9-12
- Everything You Wanted to Know About Climate Mobility But Were Afraid to Ask
- Harnessing the Power of Communities to Fight Flooding and Protect Our Waterways
You can check their K12 Student Educators Events page for a timeline. Past events display a link to the recording.
3. National Science Teaching Association (NSTA)
The NSTA offers a variety of videos on its Our Beautiful Planet website. Each seeks to showcase climate science research. Videos are five to seven minutes long and include classroom lesson plans.
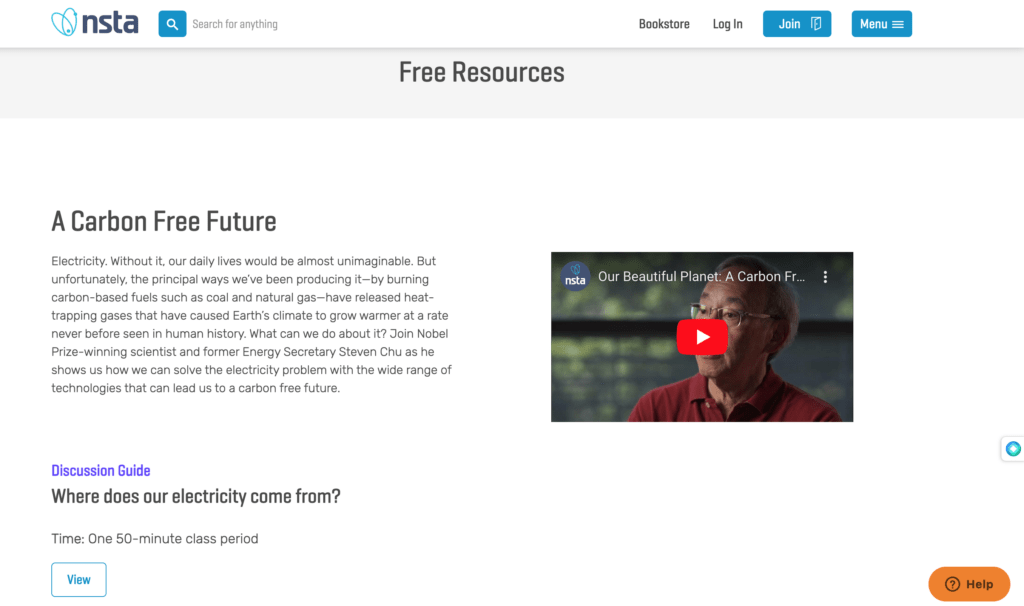
Here are a few of the free resources available:
- A Carbon Free Future
- Fire on the Mountain
- Saving Our Shores
- After the Flames
- Dust Rising
- And many more
4. Melting Ice
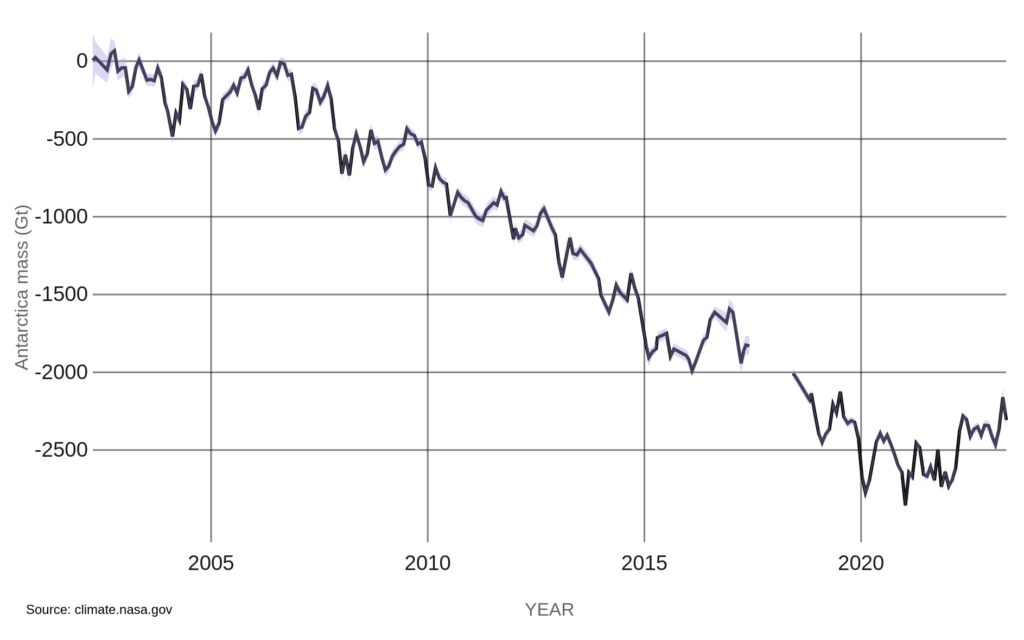
The growing loss of sea ice, glaciers, and more is raising a few eyebrows. There is genuine concern among scientists. Antarctica is losing ice mass due to melting at an average rate of 150 billion tons per year. Greenland is adding to the sea level rise with 270 billion tons of melted ice (source).
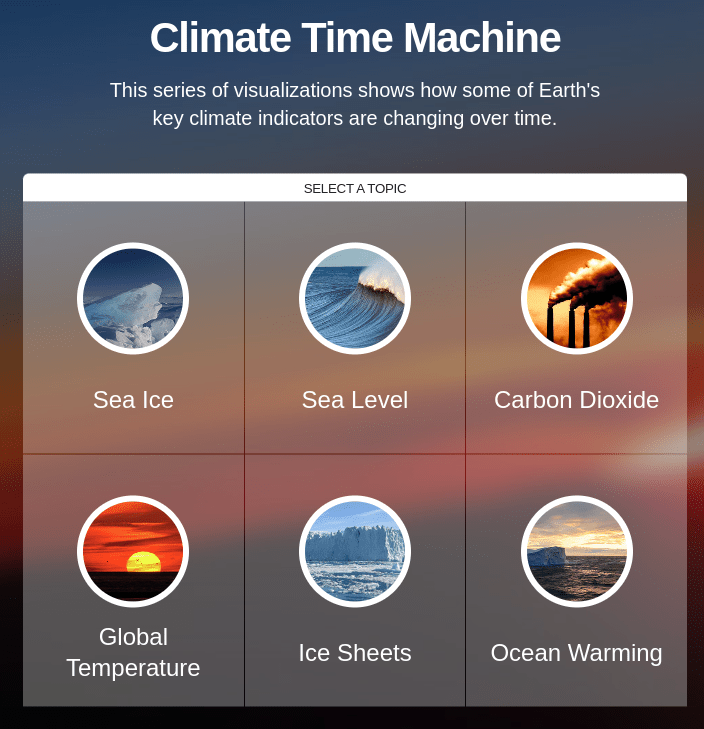
NASA’s Climate Time Machine offers a sobering look at changes in the following areas:
- Sea Ice
- Sea Level
- Carbon Dioxide
- Global Temperature
- Ice Sheets
- Ocean Warming
Each offers a time-lapse featuring some change. You can watch global temperature rise from the year 1884 through 2022. It’s amazing to see the map change from blue to red the closer one gets to the present. The Sea Ice map shows changes from 1979 through 2022 as the ice melts.
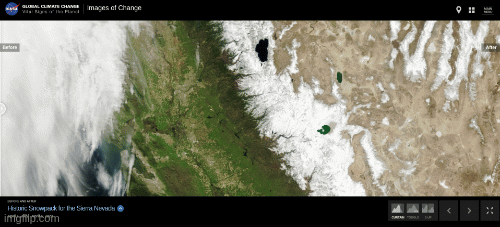
NASA’s Images of Change also offers before and after views. Consider the change in the snow of the Sierra Nevada from 2022 to 2023:
5. Teaching Climate in Texas
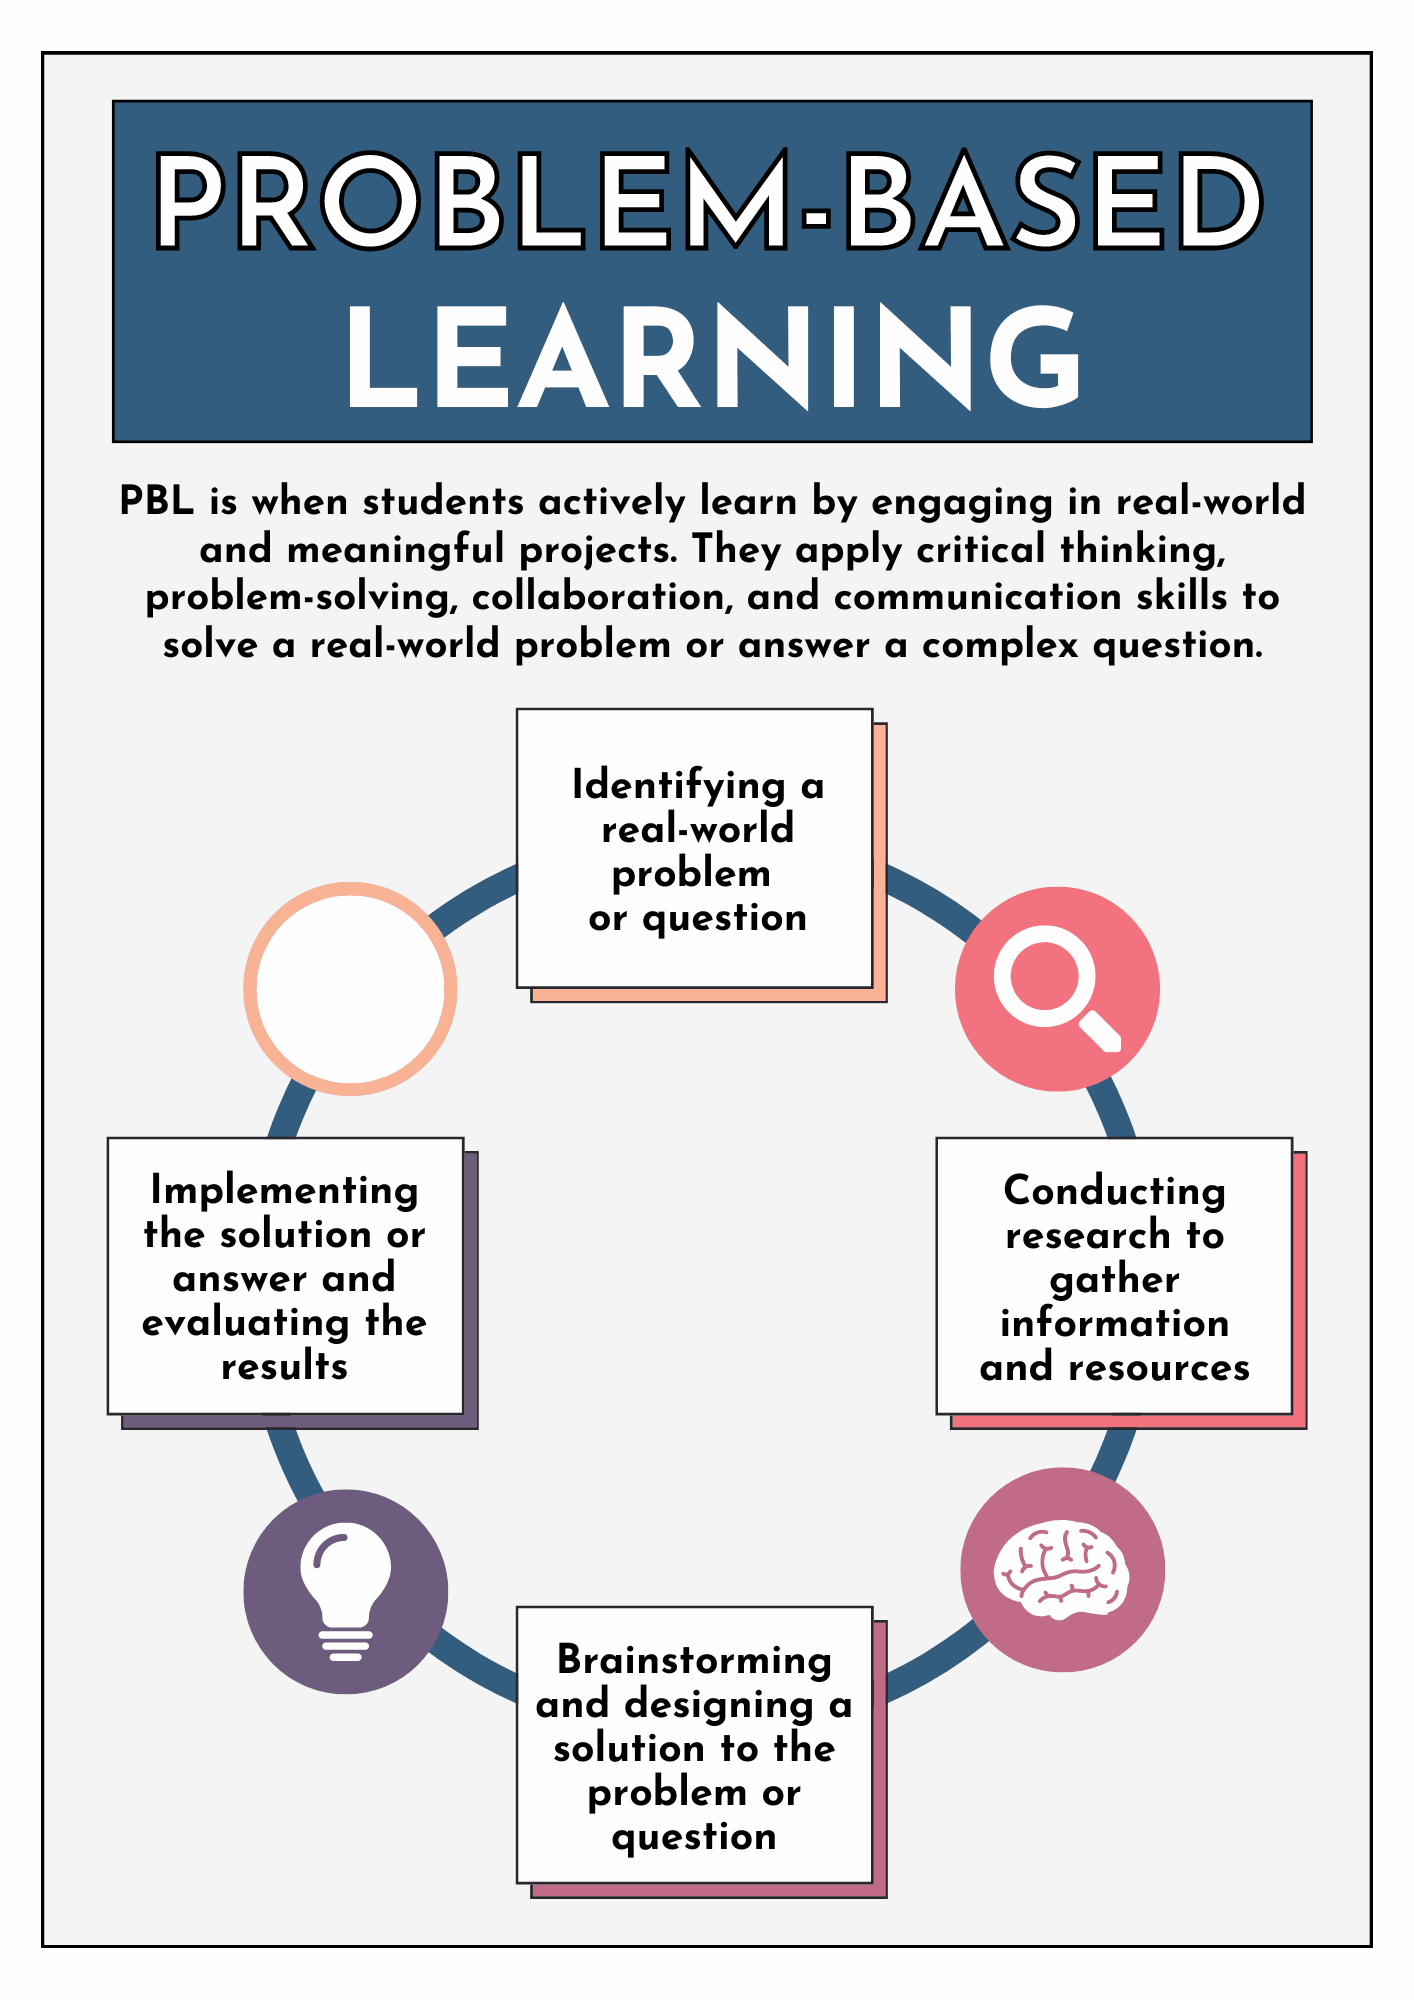
You can model approaches like Claim-Evidence-Reasoning (CER) for students. Given extreme heat waves blanketing the country and the world, you can also use Problem-Based Learning (PBL). Other strategies include:
- Conducting a lab as well as
- Encouraging students to take measurements and try wet bulb temperature experiments
- Viewing relevant videos
- Reading a story or novel on the topic
- Working in a school garden (source)
What’s more, you can take advantage of resources such as:
- Meadows Center Lessons on Weather vs Climate (TEKS-aligned)
- National Science Teaching Association (NSTA)
- National Center for Science Education
- Think Earth Environmental Education Foundation
Bonus Resource: University of Maine
The University of Maine also offers a variety of resources and websites. Be sure to explore these to see images of Earth.
When I first started reading about extreme heat, my hope had been to learn more about it. In my own journey to record temperatures, explore what wet bulb temperature means, I learned quite a bit. I have no doubt students in grades 6-12 would appreciate access to information about the world around them. Facilitate their exploration.
1 comment
What an incredible collection of resources! This is a must-read for any educator looking to make climate science relevant and actionable in the classroom. Thanks for making such a complex topic approachable for students—and teachers alike.