

If you’ve read my previous posts here on TechNotes, you may be able to guess that I’m a big fan of maps. Not only is geographic literacy a required part of many social studies standards, using maps can also help learners make visual connections with the sometimes abstract thoughts, ideas, and facts that maps can represent, from population to the physical landscape, economic factors or cultural ones. The critical thinking that using maps creates can be a help for any teacher at any level and in any subject, not just geography.
Maps become even richer sources of inspiration, understanding, and analysis when we add data to geography.
Learning Across Subjects
Moreover, subject teachers beyond social studies can make extensive and effective use of maps that include other information, along with physical representation of a place. Science educators in particular can use maps to visualize change over time or understand the science behind the physical world.
As the National Association of Geoscience Teachers (NAGT) puts it:
Using maps in the classroom invites curiosity, encourages exploration and inspires problem solving. Maps can be used to explore a multitude of topics and can incorporate visual learning, spatial thinking and quantitative skills into a lesson. Read on to explore vivid imagery from maps and learn how our online lessons integrate mapping and help you create innovative lessons.
“Teaching with Maps,” NAGT via https://serc.carleton.edu/k12/maps.html
Of course, understanding maps, along with charts and graphs, is vital for engaged and active participants in society — the kind of people educators hope to create. As Daniel C. Edelson of Esri writes:
Also like reading and basic math, learning to read a map is a foundational skill that is an essential prerequisite for subsequently developing a wide range of knowledge and skills. A brief review of the media that children see in their schools, homes, and communities reveals how frequently maps are used to convey important information and relationships. In the most recent National Assessment of Educational Progress in Geography (conducted in 2010), 58 percent of fourth grade teachers reported that they use maps or globes in their instruction at least once a week.
For this reason, a delay in learning to read maps or a lack of proficiency in reading maps can be an obstacle to academic and intellectual progress.
“The Importance of Teaching Children to Read Maps,” Daniel C. Edelson. https://www.esri.com/about/newsroom/arcnews/the-importance-of-teaching-children-to-read-maps/
Regarding science education, the Science Education Research Center (SERC) at Carleton College describes maps as way to teach data collection and comparison in science, as evidenced in this activity. They also offer links to useful science and mapping related tools, like customizable maps, maps of geologic information, and much more.
Mapping the Effect
One great advantage of maps is that they can quickly and visually represent complex situations or ideas. With modern technologies, apps, and tools, we can combine the easy-to-digest information of an infographic with a geographic overlay of space: a data-rich map.
Effective geography teaching includes not only the use of maps, but multimedia, project-based learning and more. This kind of focus, especially if paired with a “whole school” approach involving service projects and cross-subject learning, can help build (PDF) good citizenship skills and information literacy, too.
Maps are flexible tools. Students can interact with them in a number of ways and using a number of techniques (PDF) for meaningful instruction. These could include PBL, group discussions, field trips, and more. A 2007 suggests that “interactive maps show promise in making the complexities of the social sciences (especially historical geography) more interesting to students, and easier to visualize and understand, without demanding significant investments by schools,” and found that interactive maps could have a stronger impact than paper maps.
A two-group experiment examined this potential for the 7th Grade Utah Studies curriculum. After completing an exercise to analyze possible historical and geographical causes of settlement patterns in Utah, students using interactive maps showed significantly better improvement between a pretest and posttest than students using paper maps. Although some of the test results were inconclusive and highlighted technological and resource obstacles to the widespread adoption of interactive mapping in the classroom, it has been shown to help students learn social studies in a deeper, more
Plewe, Brandon & Taylor, Whitney. (2006). The Effectiveness of Interactive Maps in Secondary Historical Geography Education. Cartographic Perspectives. 55. 16-33. 10.14714/CP55.325.
engaging manner.
For Elementary Learners
National Geographic’s Map Skills for Elementary Students is a great place to find map-related lessons and activities that develop spatial reasoning, which can help build math skills in young learners.
Spatial thinking is one of the most important skills that students can develop as they learn geography, Earth, and environmental sciences. It also deepens and gives a more complete understanding of history and is linked to success in math and science. Young students also enhance their language skills as they collaborate and communicate about spatial relationships. Students who develop robust spatial thinking skills will be at an advantage in our increasingly global and technological society.
“Map Skills for Elementary Students,” National Geographic. https://www.nationalgeographic.org/education/map-skills-elementary-students/
Spatial reasoning is a vital skill for young learners, and geography education, including highly visual maps, can help, especially when thoughtfully assessed. Looking to match maps with your age group? Check out these tips on developmentally appropriate geography from the National Council for the Social Studies.
Infographic Upgrades
For those able to subscribe to a service that provides many different information-dense maps, the Data Atlas of the World may be a good choice. The maps included on this site are built in Adobe Illustrator with data imported from Microsoft Excel. The maps and visualizations are produced by Carrie Osgood, a Pulitzer Prize-nominated visual data journalist and professor.
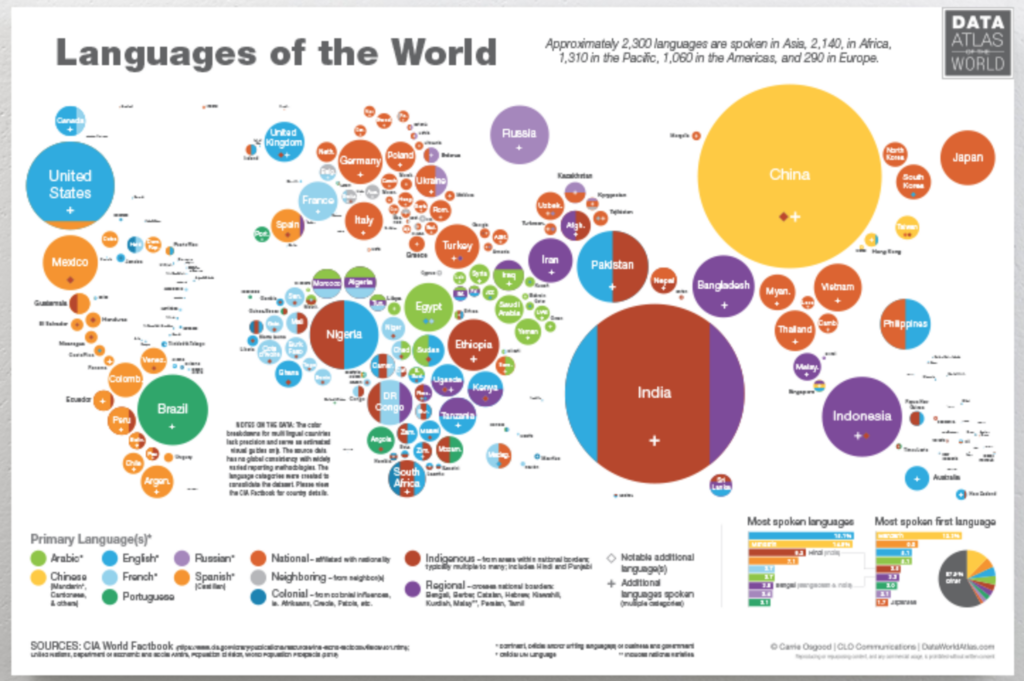
By combining maps with data, students can visualize multiple ideas at once, including things across space and time. You can check out some free samples to get a sense of whether these tools are right for your students. If you’re interested in subscribing, yearly, monthly, and weekly options are available. Educators looking to design their in-person learning environment can also purchase posters of the Data Atlas of the World maps.
Going Further with Visme
Beyond just maps, the free online platform Visme includes timelines, graphic design elements, videos, and more. Notably, its automatic map generator is easy to use and includes a number of templates. Available as a limited free version or a more robust paid version, Visme includes stock imagery, animations, data visualization templates, and many other graphical gewgaws to enhance geography lessons.
Besides maps, a number of presentation tools are also available. Here’s how one high school biology teacher uses Visme, or how an instructional technologist uses it to build interactive courses.
Unearthing More Possibilities
For educators looking to build their professional learning on the subject, several professional, corporate, and nonprofit organizations offer resources for teaching with maps. Check out the list below.
- Resources for teachers from the U.S. Geological Survey (USGS)
- The National Council for Geographic Education
- The American Association of Geographers
- The National Council for the Social Studies
- The National Association of Geoscience Teachers
- GeographyEducation.org
- Education products from Rand-McNally
- Web resources from Pennsylvania State University Libraries
- Teaching with Maps from Carleton-SIRC
- Instructional resources from Esri
- Education on Google Maps
- Mapping resources from National Geographic
Phoenix7777Own work / CC BY-SA (https://creativecommons.org/licenses/by-sa/4.0)