

Are you spending hours lining up ovals and squares in your favorite graphic organizer program? My routine involves crafting a first draft of my great ideas in concept maps that span pages. Then, I refine them into concept maps to share with others.
Visual learning facilitates comprehension for those who struggle with abstract concepts. Working through an academic text, I often make a concept map. Tools like Draw.io (also known as diagrams.net) and MXStudioGraph (see free AI tool to convert writing into code) can serve as essential instruments for creating clarity. How can you leverage these free tools and concepts in your K-16 work? Let’s see how to harness visual learning with these free tools.
Revisiting the Research
Wondering what the scientific consensus is on the use of visual tools for constructing knowledge? Consider these points about the power of graphic organizers:
- Organize and comprehend information. Working at the Deep Learning phase, graphic organizers assist students in seeing relationships between ideas. This relational aspect, how facts and perspectives connect, reflects the Deep Learning phase (source).
- Enhance critical thinking. Compare and contrast diagrams, as well as cause/effect organizers, encourage deeper processing of information (source).
- Non-linguistic pathway to understanding. Students with learning disabilities (source) can benefit from diagrams with minimal words to organize their thinking.
- Improve metacognition. Using organizers assists students (source) in seeing “the big picture” about text, stimulating meta-cognition (source).
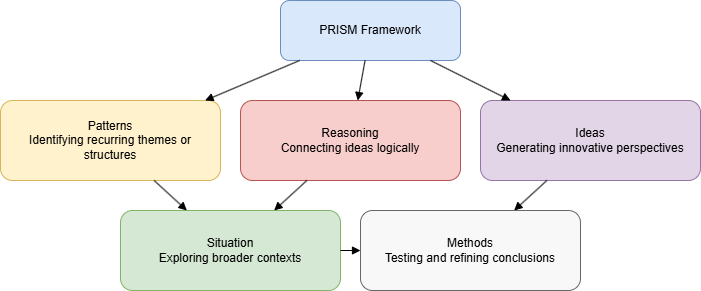
You can find an overview of these ideas in the PRISM Framework, adapted from Biggs’ SOLO Taxonomy. What’s your plan for learning new information, to help you see the connections? Having a strategy is important. That’s why I like the PRISM Framework and use it when possible. One way to identify and see patterns could involve the use of AI to scaffold your awareness. But one can get lost in the dense thickets of academic text.
A Hattie Connection
These diagramming tools (e.g. Draw.io) support high-effect size instructional strategies. No doubt, you are familiar with John Hattie’s and Corwin Press’ Visible Learning MetaX database. When students visually organize information, they engage in deeper cognitive processing. A Deep Learning strategy, Concept Mapping has an effect size (d=0.66).
Note: Although I use the term “visual learning,” it should not be confused with the visual learning of discredited learning styles (e.g. Fleming’s VARK model featuring four sensory modalities to receive and process information, although they are really cool, they lack empirical evidence). Learning styles fall into neuromyth territory. Fortunately, we have evidence through high-effect size instructional strategies.
It assists students in building relationships between ideas and gaining a deeper conceptual understanding. With digital tools like Draw.io, students can link concepts, add explanatory text. What’s more, they can visually represent hierarchies and connections. This moves them towards the “Relational” and “Extended Abstract” levels of understanding as described in the SOLO Taxonomy. It aligns with the “Deep Learning” phase where learners integrate and connect knowledge.
Other related high-impact strategies that tools like Draw.io facilitates include:
- Outlining and Organizing: With an effect size of 0.84, this strategy helps students structure information, which supports critical thinking and problem-solving. Draw.io can be used to create visual outlines that are more dynamic and interconnected than traditional linear notes.
- Graphic Organizers: Tools like Venn diagrams, flowcharts, and cycle diagrams help students categorize information, see relationships, and reduce cognitive overload by breaking down complex information into manageable sections. The ALDO framework also points to the use of graphic organizers.
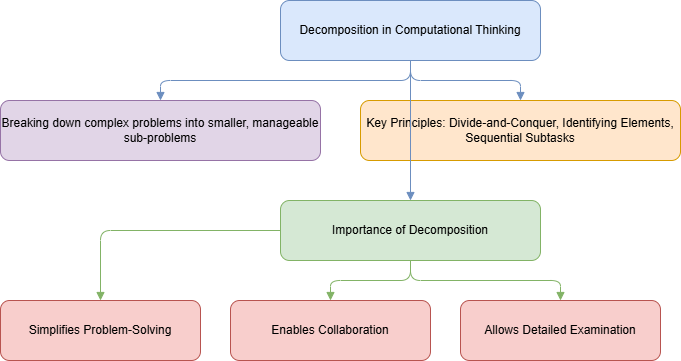
- Computational Thinking. Consider that Decomposition might be another way to interpret helping students break down problems and information into easier to manipulate and solve chunks.
Let’s address the elephant in the room first. This article requires Generative AI use.
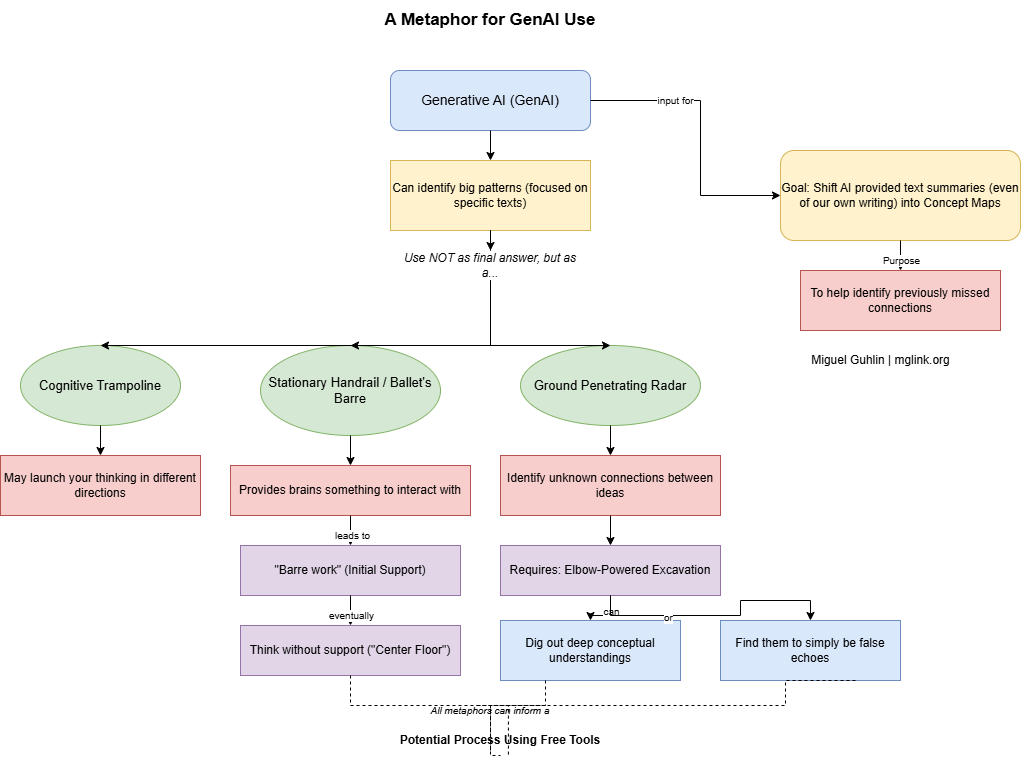
A Metaphor for GenAI Use
Generative AI can, focused on specific texts, identify big patterns. In this situation, use GenAI not as a final answer but as a cognitive trampoline that may launch your thinking in different directions.
Or consider it a stationary handrail to provide our brains something to interact with. Eventually, we can step away from this “barre work” to the center floor to think without support. But how do we shift AI provided text summaries, even of our own writing, into concept maps to help us identify previously missed connections?
Perhaps we can use GenAI like a ground penetrating radar to identify unknown connections between ideas. Then, with some elbow-powered excavation (I don’t own a mechanized excavator), we can dig out the deep conceptual understandings that may be there in our own work and that of others. Or, find them to simply be false echoes.
Whatever your metaphor, trampoline, the ballet’s barre work or ground penetrating radar, let’s take a look at a potential process using free tools.
Free Tools
In this blog entry, I’d like to introduce you to two tools. The first is code-based, not unlike Mermaid syntax I’ve written about before. However, where Mermaid syntax results in a clunky concept map, MXGraphXML offers more beautiful creations and flexibility. To make generating code easier, use this free custom Bot I made for the purpose:
Here’s what that looks like:
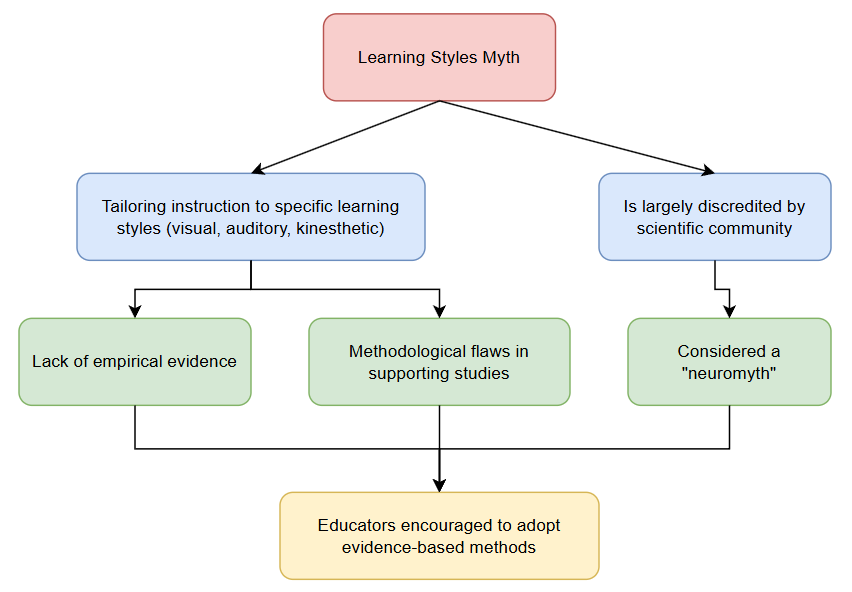
You will combine the MXGraphXML code with a free diagramming tool to get a concept map (as shown above) that you can modify and rework. Wait, before you panic, there’s no coding involved. Let’s get a little background on both tools.
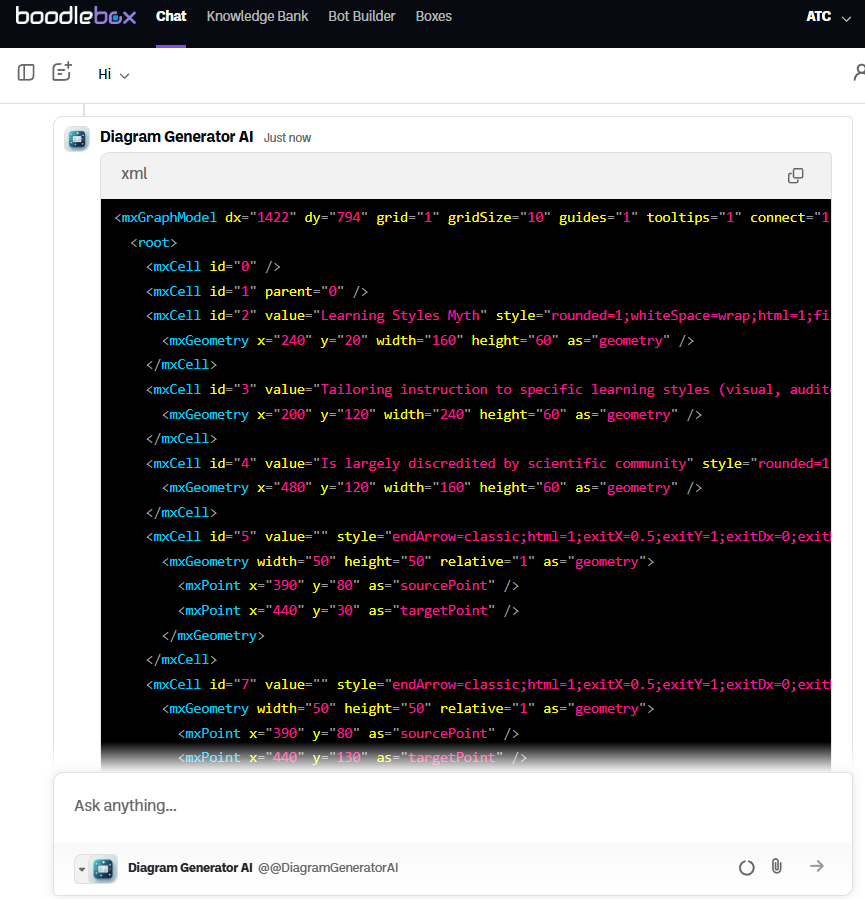
AI Generated MXStudioGraph Code
MXStudioGraph is built upon the robust foundation of mxGraph. It is an open-source JavaScript library renowned for enabling interactive diagrams and visualizations. Educators and students can use MXGraph code to design, edit, and visualize a wide array of diagrams. This can mean creating anything from simple flowcharts to complex network structures. To keep things simple, students and staff control the generation of the code through natural language interaction with GenAI.
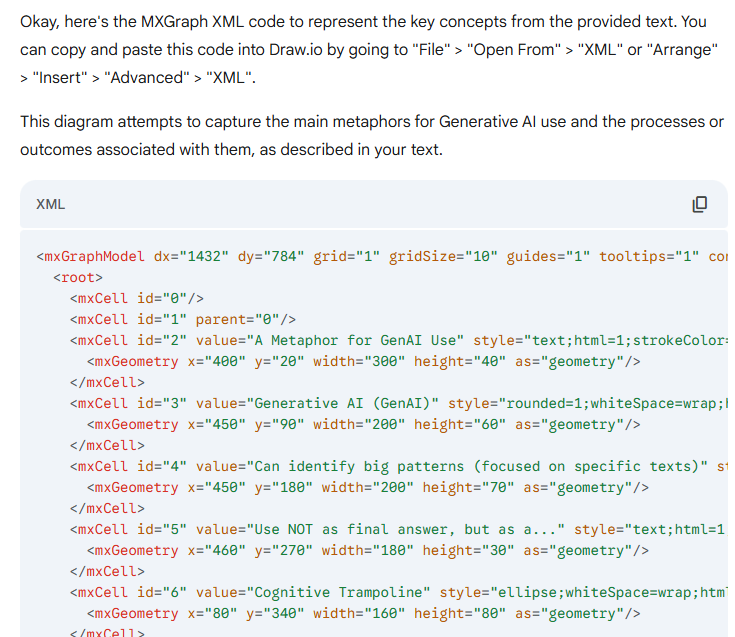
For example, to render the section of this text A Metaphor for GenAI Use, I used a simple prompt:
Use MXGraph XML code compatible with Draw.io to capture the key concepts in this selection of text: [A Metaphor for GenAI Use text]
This resulted in:
Drawio A Free Accessible Diagramming Solution
The resulting code is useless to me without some way to turn it into a more visual tool. To accomplish that, I rely on the free, open source Draw.io that you can install on your Windows, Mac, or GNU/Linux computer (or access via diagrams.net). It is a fantastic tool I relied on as an educator and technology director for a variety of diagrams. It leverages the same mxGraph engine mentioned above.
Some benefits of Draw.io:
- Completely Free: There are no hidden costs, subscriptions, or mandatory accounts. Both the online editor and the desktop app (available for Windows, Mac, and Linux) are available at no charge. If you ever had to justify purchasing Inspiration for a K-12 school district, you will appreciate such a powerful tool available for free.
- No Account Needed: You or your students can begin diagramming immediately without the hassle of sign-ups or logins.
- Flexible Storage Options: You can save diagrams to popular cloud services like Google Drive, OneDrive, and Dropbox, or directly to your device. You can run it without internet access, too.
Some other benefits? You can run it locally on your device or via the web. It also features integration with cloud storage if that’s a need (such as a Chromebook environment), and supports collaboration.
Unlocking Learning K12 Classroom Use Cases
Having students struggle with writing can be powerful. When you use GenAI as a way to convert student-authored content into a diagram using natural language, this means students might perceive their writing in a clearer fashion. They can see the relationships and concepts. What’s more, once the AI-generated MXStudioGraph code is in Draw.io, they can manipulate it to say what they want it to, restoring agency and ownership.
Some more uses:
- Graphic Organizers and Mind Maps: Students can brainstorm ideas, map out complex concepts, and visually structure information for essays, research projects, or study guides.
- Timelines and Story Maps: Ideal for social studies and literature, students can create chronological timelines of historical events they have created or develop storyboards to analyze narrative structures.
- Scientific Illustrations and Process Flows: Labeling diagrams of biological structures (plants, animals), chemical processes, or ecological cycles becomes more interactive and clear with custom shapes and connectors.
- Mathematical and Logical Reasoning: Construct Venn diagrams to explore set theory, build flowcharts to outline problem-solving steps, or even create geometric figures to support mathematical reasoning.
- Collaborative Projects: The real-time editing feature empowers student groups to work together seamlessly on shared diagrams for presentations, group assignments, or inquiry-based learning activities.
- Assessment and Review Tools: Teachers can design visual quizzes, create concept maps for review sessions, or use process flow diagrams to assess students’ understanding of sequential information.
Getting Started Is Easy
Get started by visiting the free online editor at app.diagrams.net or by downloading the desktop application.
Follow these steps:
1) Use your favorite GenAI tool, dropping text in with this prompt:
Use MXGraph XML code compatible with Draw.io to capture the key concepts in this selection of text: [text or link to text]
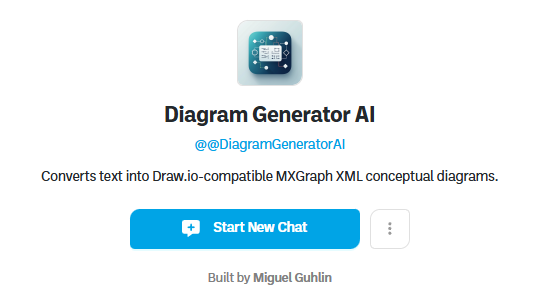
GenAI tools like ChatGPT, Gemini, Perplexity, Mistral.ai, Copilot, Raina have built-in support for MXStudioGraph. But, they can be finicky. To assist you in avoiding that, use the TCEA Diagram Generator AI (requires a free ChatGPT account).
Note: You can see an example of this earlier in this blog entry in the AI Generated MXStudioGraph Code section.
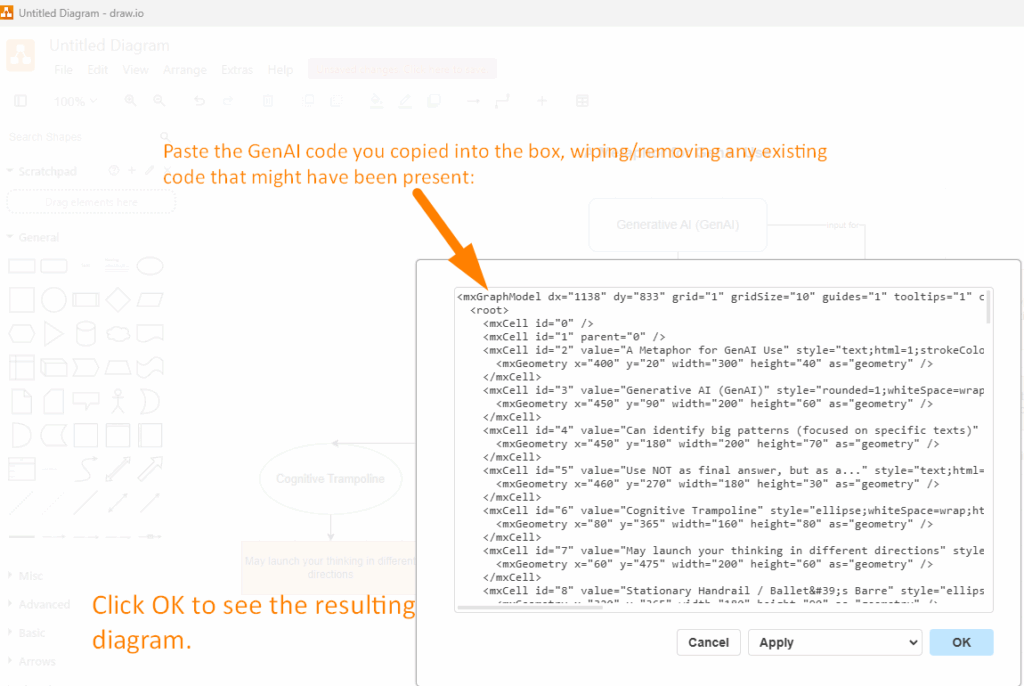
2) Copy the code
3) Paste the code into Draw.io on your computer or browser, depending on which you chose to install or use:
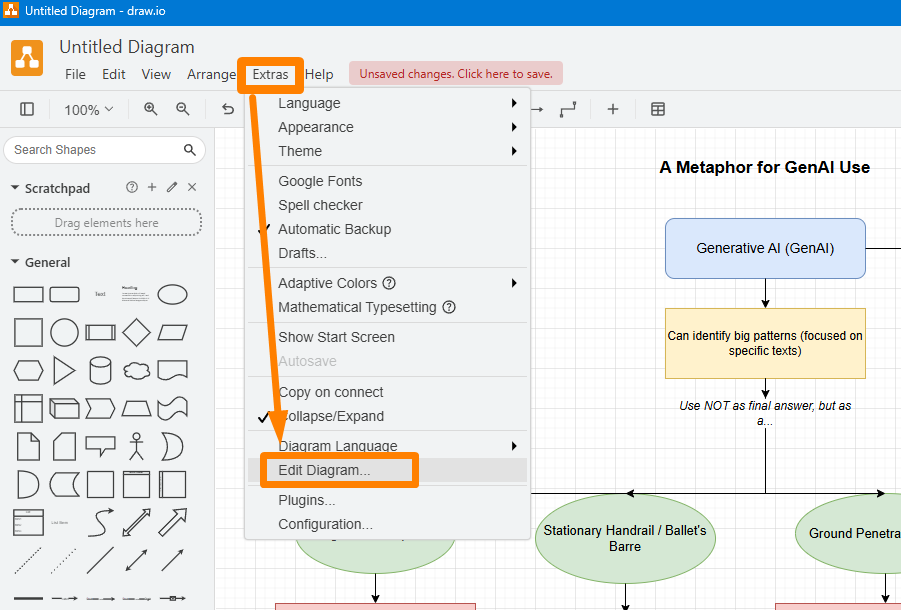
Then, paste the code:
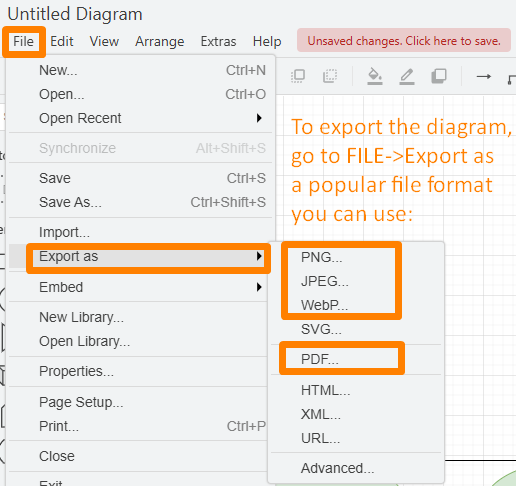
4) Modify diagram, then save your changes. You can also export the diagram in a variety of formats:
Give it a go, it’s not as hard as you might think.
Harness Visual Learning Tools
Students will both have fun and extend their digital toolbox when creating visualizations. Digital tools like Draw.io can make that possible. Mix in GenAI generated MXStudioGraph XML code renditions of author-created writing. Free, avoiding student user accounts, usable from grade 3 through adult learners, AI-powered Draw.io offers a powerful choice to manipulate deep learning connections. You now have a tool to better identify and map deeper conceptual thinking in your own work or that of others.
But Wait, There’s More!
For more information on learning styles and implications for classroom usage, be sure to read:
Robinson, D. H., Yan, V. X., & Kim, J. A. (Eds.). (2022). Learning styles on trial: Implications for classroom instruction and student achievement. Springer. https://doi.org/10.1007/978-3-030-90792-1 (Reviewed by Kassandra R. Spurlock)
2 comments
This is amazing, Miguel! Thank you for sharing.
Thanks, Dr. Rose. This can be real time-saver, but more importantly, a way to interact with concepts in a visual way aligned to evidence-based strategies. This blog entry has been updated to reflect a BoodleBox AI version of the Diagram Generator AI (which now relies on Gemini 1.5). The original, built-in ChatGPT Custom GPT, may work erratically since they allow end-users to adjust which AI model optional to use.
Let me know how you decide to use it!
Miguel