

Infographics allow students to share a lot of information in a visually-pleasing but concise way. While there are lots of tools that you can use to create and publish infographics, you might want to give Wakelet a try!
Wakelet is a content curation tool that allows you to collect and share many types of resources. When we think of curaction , we typically think of playlists with just videos or music or Pinterest boards with websites or photos. The amazing thing about Wakelet is that it lets you pull together all sorts of file types, including URLs for websites, text, YouTube videos, tweets, bookmarks, images (from your device or from Unsplash), PDFs, Google Drive files, OneDrive files, and Flipgrid videos! For the purpose of infographics, we’ll be using just images from our device. Let’s begin.
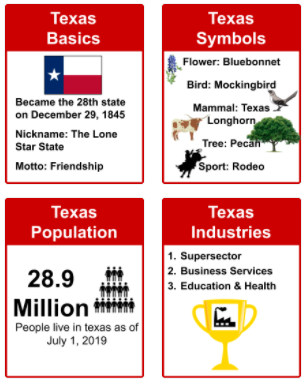
PREFACE: For this article, I’m using the following hypothetical assignment: Social studies students will investigate various details about Texas to identify specific information about the history and details of the state. Students will work in pairs with each pair being assigned a specific aspect regarding Texas. Student pairs will each create Google Slide presentations to share their information. The first slide of the presentation will be saved as an image and used in the Wakelet collection. Students will refer to the collaborative infographic as they share their specific aspect and as a review for a unit quiz.
Getting Started
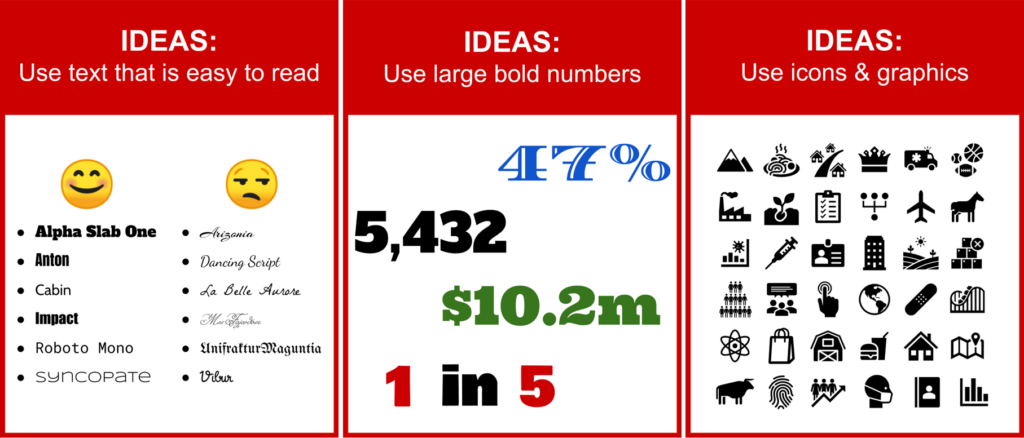
Begin by sharing a Google Slides slide deck with your students. For your convenience, start by making a copy of this Blank Infographic Slide Deck. Taking into consideration your specific assignment and students’ abilities, edit the slide deck as needed. Included in the slide deck template are three slides with helpful ideas for text, use of large numbers, and icons.
Once students finish slide one of their deck, have them click on FILE–> Download –> PNG. This will save the slide as an image that will be used in Wakelet. You might consider having students compete the first slide AFTER they finish the other slides so that they already have the details. Other options would include having all students work on a single slide deck with each pair of students assigned a particular slide number; in this situation, students can add details to the speaker notes.
Preparing the Wakelet
Now let’s jump to Wakelet and prepare it for our students to add their part of the infographic. Begin by creating a new collection. You can do this by clicking on the green plus button labeled “Create a new collection.”
Add a meaningful cover image to your collection. You can use sites such as Pixabay, Pexels, FreeImages, Free-Images, Unsplash, Pics4Learning, and CC Search to locate copyright-free images to use with your students. Be sure to investigate each site before sharing with students. You will also need to pay attention to citation requirements for particular sites. Here are a few other helpful blog posts to help you find and use copyright-free images:
- Copyright-Free Images for Student Work
- The Educator’s Guide to Copyright, Fair Use, and Creative Commons
- Creative Commons: Make OER Copyright Simple
- Simplify Your Search for Copyright-Free Images
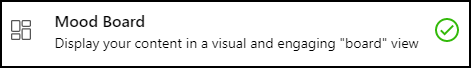
Now that you have your Wakelet collection shell started, click on Done. Go back in to edit the collection (yes, it seems redundant to have to do this, but it allows you to set the collection format). Below the title/description area of the collection, you should now see a dropdown box allowing you to select the format of the collection. Choose the Mood Format. Media view is too large and doesn’t place images side by side. Compact and Grid views will make your image appear cropped; you’ll have to click on each image to view the full image. Mood view will not crop the image, but will show all the images in a pleasant viewing format.
Getting the Students Involved
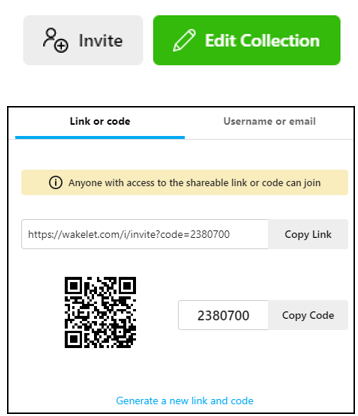
It’s now time to have students add their portion of the infographic to the collection. To make this possible, you will need to share a link with your students that give them edit rights to the collection. Anyone with this link can edit, so don’t tweet or share via social media. (You can, however, share the published version of the collection with others, which is a different link that we’ll talk about later.) To access the dialog box to get the link, click on the Invite button. In the dialog box, you have the option to share a link/code or add students’ usernames/emails. For our purposes, we will assume that students do not have a Wakelet account. To make sharing easier, copy the link to share with your students (not the code). If you would like to see what the students will experience, go to this site.
Once the students have the link, they can start adding to the collection to create the final infographic. Drag the images around to reorder them so that they make sense.
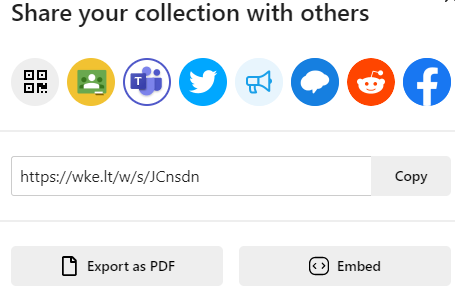
When everyone has their image added to the collection and you’ve ordered the images as you prefer, it is time to share the final product. Wakelet gives you so many ways to share. If you prefer a QR code, click on the QR code button and then right-click on the QR code to copy the image or save the QR code image to your device to post where you would like it to be. Other sharing options include Google Classroom, Microsoft Teams, Twitter, Notify, Remind, Reddit, and Facebook. You can also copy the link (this link is one for users to view your collection – NOT edit). And you can export your collection as a PDF or get the embed code for the collection to place on a class website or in your LMS.
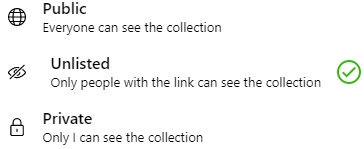
Depending on the content of the infographic, it may be advisable to set the visibility of the collection to Unlisted. This allows anyone with the URL to view the collection, but does not make it available for others to find it via search engines. If you and your students add any resources that are part of Google Drive or Microsoft Teams, be sure that you have those documents set with the correct share settings as well so others can view the final Wakelet products. Making your collection public or unlisted doesn’t change the share settings of the resources that have been added to the collection.
Content Area Ideas
Mathematics
- Create a collection that highlights different geometric shapes – squares, rectangles, circles, triangles, etc.
- Create a collection that identifies the different categories of numbers – whole, fraction, decimal, integers, etc.
- Create a collection that illustrates different slopes – negative, positive, parallel, perpendicular, slope=0, undefined, etc.
Language Arts
- Create a collection identifying different part of phonics or phonics rules
- Create a collection identifying main characters of a novel or chapter book
- Create a collection of vocabulary “cards” to help ELL and ESL students
Science
- Create a collection identifying the different systems in the human body
- Create a collection noting various animals of different classes (mammals, fish, birds, reptiles, and amphibians)
- Create a collection illustrating a food chain with the predators/prey in accurate order
Social Studies
- Create a collection that highlight different countries and their flags
- Create a collection highlighting famous people who helped with a particular cause or event
- Create a collection of political cartoons
- Create a collection of state capitols with specific facts about the state
So, how will you and your students use Wakelet to create and inform through infographics? It is a an easy process that helps students focus on learning during the process, as well as providing a means of review afterwards. Share your idea in the comments below. And if you or your students create an infographic using Wakelet, share the link with our readers and we’ll celebrate their work with you.