

What Is Effect Size?
Before we dive into self-reported grading, let’s talk about the research. I was introduced to John Hattie’s work a few years ago, and you see the phrase “effect size” pretty much all over it. You may be wondering, “What the heck is effect size?” In his book, “Visible Learning,” John Hattie outlines “Barometers of Influence.” This is basically a scale that provides quantitative value to the desired effects we’re looking for as a result of instruction. It’s broken down into four sections representing negative, low, medium, and high achievement.
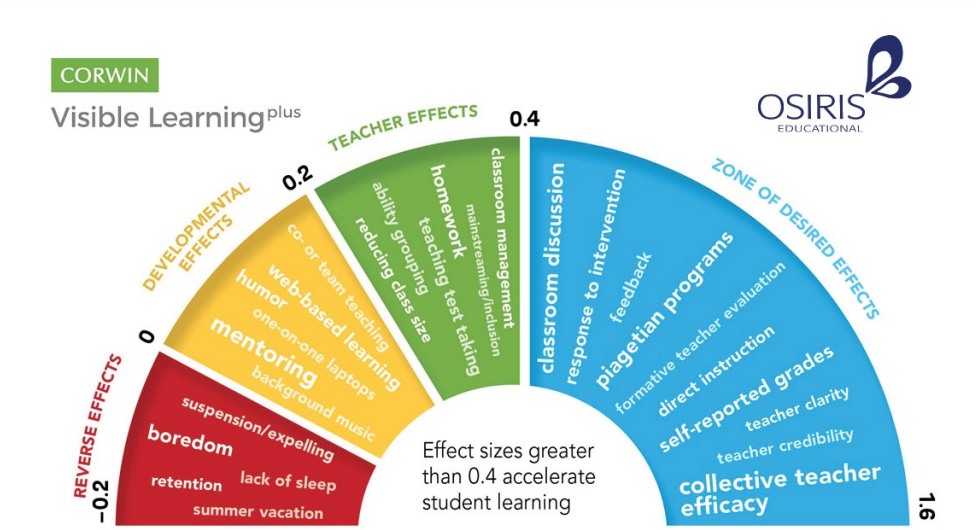
Here is a great explanation of the four sections from the Kentucky Department of Education.
Red: An effect size below zero represents strategies and actions that students may be exposed to that have reverse consequences on their learning.
Yellow: An effect size between zero and .15 indicates progress that a student can make without proper strategy instruction and guidance, where students are learning on their own through natural inquisitiveness and could achieve without schooling.
Orange [GREEN]: An effect size up to .40 represents a school year’s growth over the course of one school year. Schools that use effect sizes to measure student progress can maximize their impact on student outcomes.
Blue: An effect size of greater than .40 is the Zone of Desired Effects. Hattie’s research shows that there are many influences, when done with fidelity, will give students an opportunity to grow and have one, two, and sometimes three years of progress. Schools that use effect sizes to measure student progress can maximize their impact on student outcomes.
How Is Effect Size Calculated?
Since effect size is learning quantified, it’s important to note how these numbers are calculated. Essentially, Hattie reports calculating effect sizes in two ways (Visible Learning, p. 8):
In the first calculation, there are two groups being measured – the control group and the treatment group (experimental).
Average/Mean of the Treatment Group – Average/Mean of the Control Group
Standard Deviation
In the second method of calculation, there is one group being measured before the treatment and after the (experiment) treatment.
Average/Mean After Treatment – Mean Before Treatment
Standard Deviation
In both equations, the calculated numerator is divided by the standard deviation.
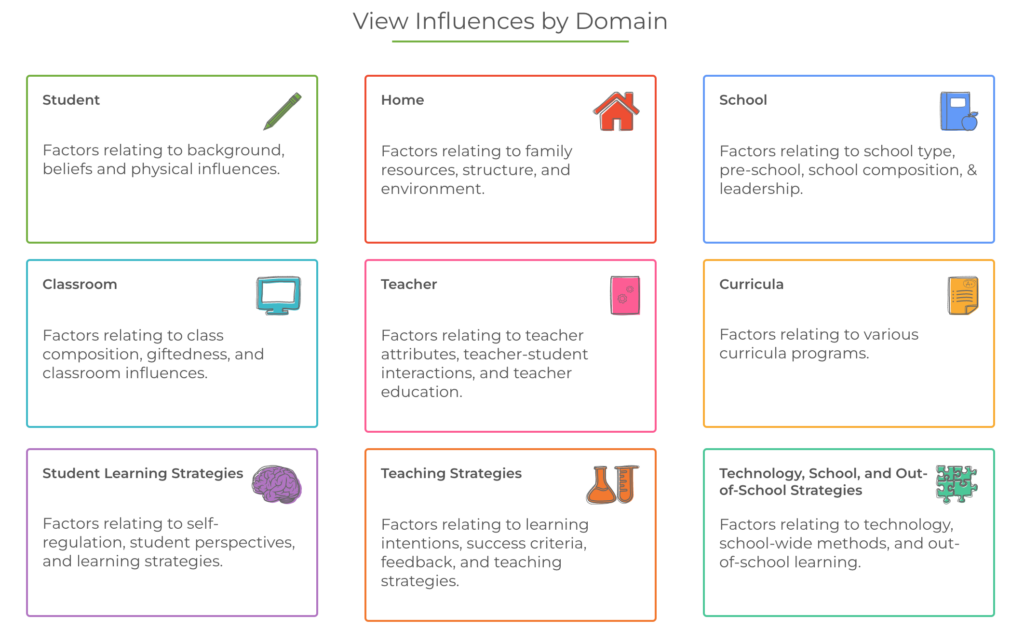
What Factors Are Considered?
Hattie has taken a multitude of influences (bullying, grouping, anxiety, coding, ADHD, cooperative learning, etc.) within nine domains and various subdomains and ranked them by impact based on his calculated effect size. The higher the effect size, the more growth the student showed and the bigger the impact. You can take a look at the full, filterable list of research on Hattie’s website. It’s pretty nifty!
What Are Self-Reported Grades?
In the Student domain, the highest-ranked influence is Self-Reported Grades, with an effect size of 1.33. That means that this has a high impact and is on the high end of the Zone of Desired Effects. Well, that’s all great, but what the heck are self-reported grades?
According to Hattie, self-reported grades are “a practice by which students assess the quality of their own work or their level of mastery over a given subject domain. The validity of such self-grading is often assessed by comparing a student’s ‘self-reported’ grade with that provided by an instructor.” Let’s see what Hattie has to say.
Sounds good, but how do you actually do this in the classroom? Let’s look at two strategies.
Goal Setting
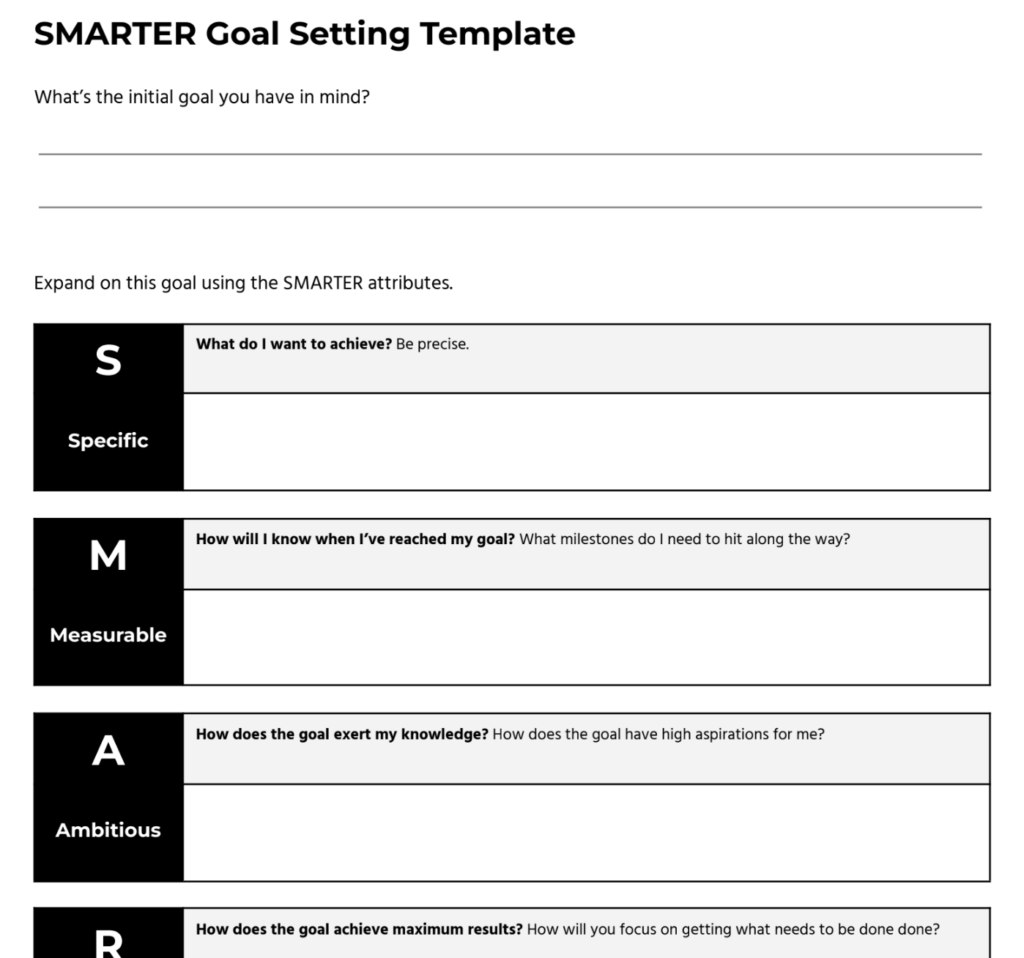
TCEA’s Diana Benner recommends setting specific SMARTER (Specific, Measurable, Ambitious, Results Oriented, Time Bound, Evaluated, Reevaluated) goals with students and then having them:
- outline their steps for reaching the goal
- identify resources that will support their work
- develop ways to monitor and evaluate progress
Younger students may need a choice board, verbal prompting, and/or to dictate their goals and plans as the teacher writes them. But upper elementary, middle, and high school students can goal set independently using Benner’s SMARTER Goals Template or an adapted version.
Rubrics
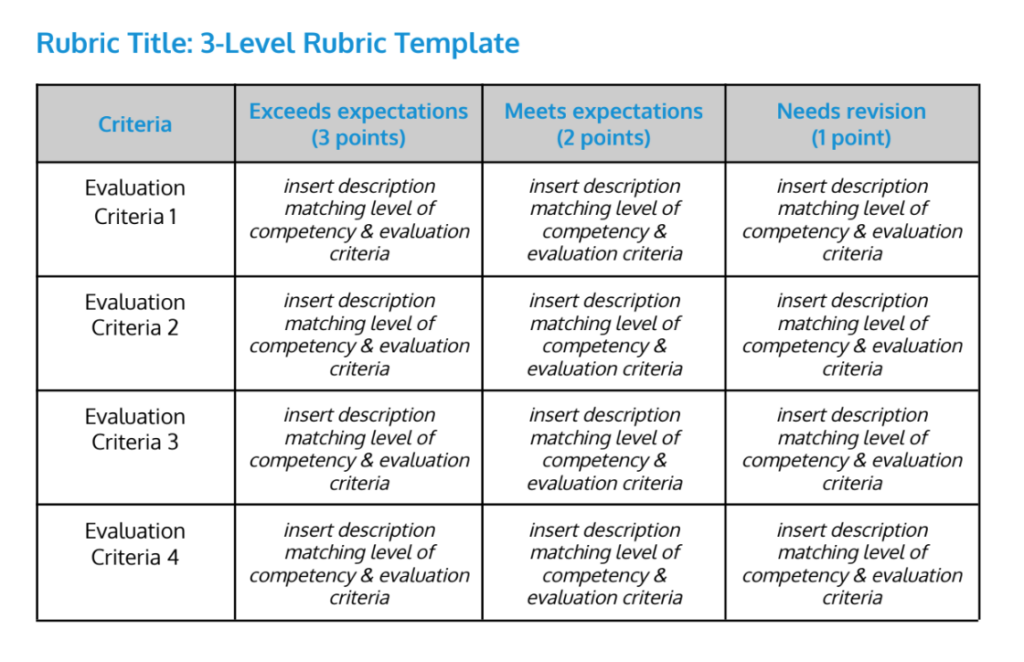
Benner says, “Rubrics are a wonderful way to give your students the power to assess their own work. As the teacher, you also grade the student’s work with the same rubric.” She suggests, as does Hattie, that after the teacher and student have both completed the rubrics, they compare the results. “By using rubrics as a way for students to self-grade, you are allowing them the opportunity to think critically about their work,” Benner said. “Regular use of self-graded rubrics will help your students learn to target their work toward your expectations. They might even have fun playing the teacher and grading their own work!” Plus, when you work with an individual student to compare their completed self-reporting rubric with yours, they can think critically to analyze the differences between the two. This can lead to a better understanding of expectations which can lead to growth.
Additionally, depending on the assignment, you can look at exemplar work with students, note what you observe together, and create a rubric with your students. Tools you can use for creating rubrics are Google Classroom, Google Drawing, and Google Docs. Feel free to use these templates created by Benner.
Knowing that self-reporting grades has such as high effect size makes it worth giving it a try with students! Have you used a self-reporting strategy before? What was it, and how did it work for your students? Share with us in the comments below.