

Teaching social studies subjects — history, civics, geography, and more — can be a challenge. Multiple elements of time and space are required to create a picture of human society, whether in the past, present, or future. Educators and students have to balance visual media, like maps, with written texts, recordings, statistics, and other sources.
For those struggling to put artifacts, primary sources, maps, and more into a digestible package, StoryMapJS, a multimedia tool from the Northwestern University Knight Lab, can be a major boon to your teaching and learning.
Meeting Learning Goals with Narrative Learning
StoryMapJS is a tool developed to build narrative maps and large “gigapixel” images combined with other media to tell narratives, that is, stories. These interactive maps can help meet many social studies learning goals. For example, in TCEA’s home state of Texas, high school history students are expected to:
- Understand “the impact of geographic factors on major events”
- “Analyze the causes and effects of changing demographic patterns resulting from migration within the United States”
- “Identify the effects of population growth and distribution on the physical environment”
- “Identify and analyze the global diffusion of American culture through various media”
- “Analyze primary and secondary sources such as maps, graphs, speeches, political cartoons, and artifacts to acquire information to answer historical questions”
- “Create a visual representation of historical information such as thematic maps, graphs, and charts; and
- “Pose and answer questions about geographic distributions and patterns shown on maps, graphs, charts, and available database”
An interactive mapping and multimedia tool like StoryMapJS can help students meet these goals (and others). Essentially a buildable, interactive collage, this tool helps build narrative learning. Stories are especially useful in history education. Historical narratives can help guide students to establish a broader historical context, understand potential causes of historical events and ideas, and formulate conclusions based on primary- and secondary-source documents.
With this tool, you can include many kinds of media, not just text, to give a richer representation of the past. Beyond the traditional essay, the interactive mapping in StoryMapJS can help diverse learners construct historical narratives with images, videos, and sound.
Introducing StoryMapJS
StoryMapJS presentations can be embedded into custom websites, WordPress, Squarespace, and Wix. To get started, simply log in with a Google account and begin editing. Each “stop” on your map is a presentation slide.
- The interface will prompt you to name your map,. Then you can create a title slide, the custom text, images with captions, and more.
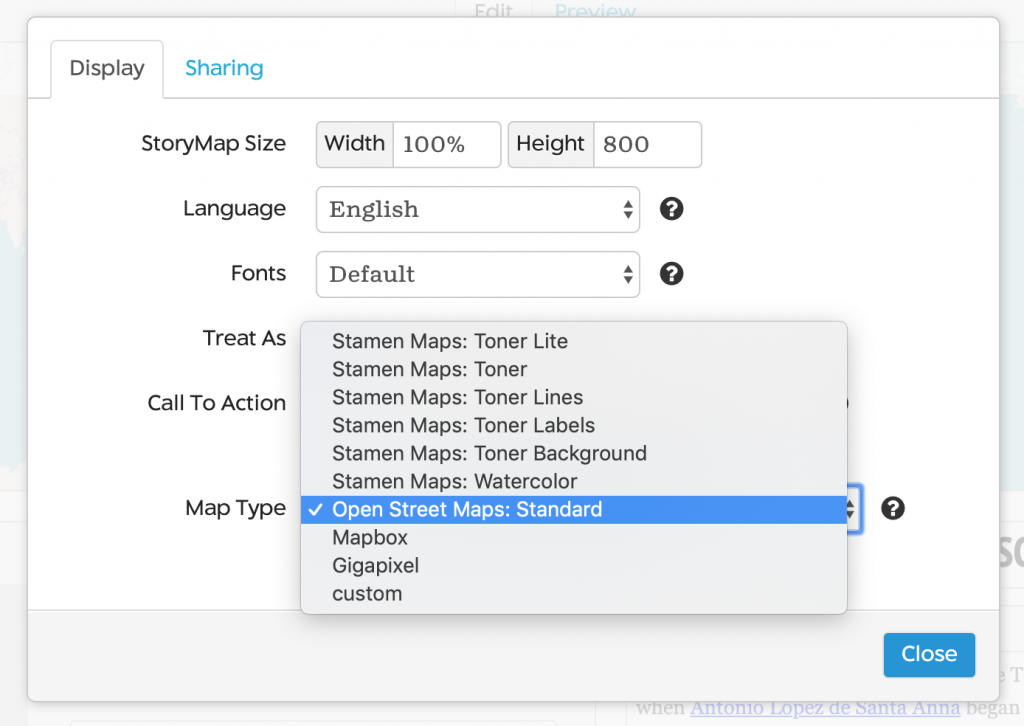
- Click “Options” in the top left of the window to set your language, the type of map or image you want to use, even fonts, sizes, and sharing options.
- Next, begin your presentation by adding a New Slide. In each slide, you’ll have the option to add a marker to the map by pasting a set of coordinates or simply searching for a location.
- Add media to your marker. StoryMapJS includes the option to upload images, add URLs, and include credits and captions. You can even customize the look of your markers.
- You can upload media, pull from Google Drive or Dropbox, add a link for YouTube, or simply upload files. StoryMapJS is a powerful tool. You can explore more options here.
StoryMapJS Examples
Developed by the journalism-focused Knight Center, StoryMapJS has been used by organizations like The Washington Post, Chicago’s Newberry library, and The Times of London. These groups experiment with the tool because it allows creators to pack lots of information from multiple formats into one presentation.
So, what does that look like? Let’s explore some examples.
Southern Literacy Trail (Georgia Humanities)
This interactive “trail” leads learners across Alabama, Georgia, and Mississippi in search of Southern literary history and culture. The interactive page includes a map, complete with a marked trail, which can be followed point-by-point, with each stop exploring history with text, photos, and hyperlinks.
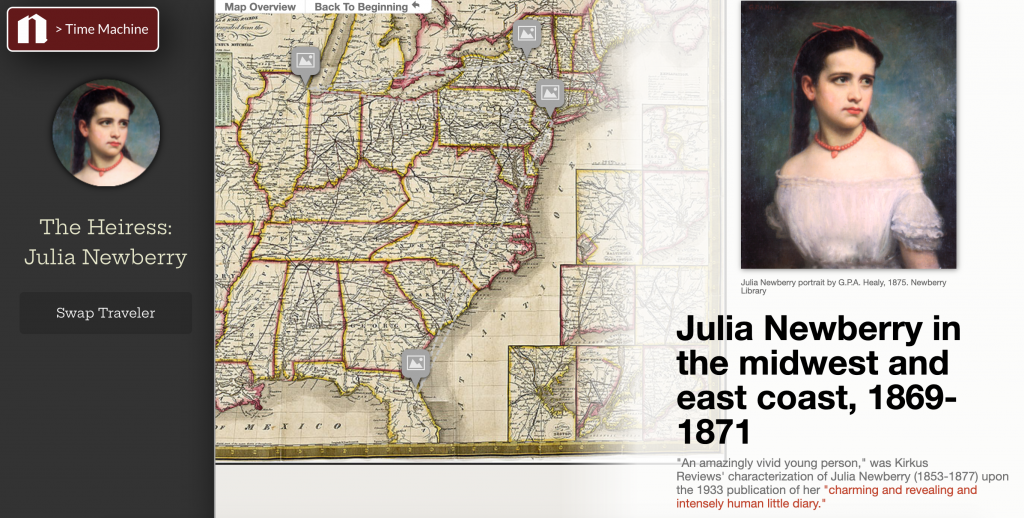
Midwest Time Machine (Newberry)
Drawing from the research library’s vast collections of documents, this project allows learners to take on the persona of various figures from Chicago’s history, which learners can choose for themselves, getting immersed in the words and images of many points in local history.
The Runaway Scrape
Here’s one I created in order to test out StoryMapJS. Hopefully it will give you a sense of what the site is capable of.
Beyond Maps: Timelines, Audio, and More
Looking for more (or more specialized) digital social studies tools? Check the other interactive projects from the Knight Center, like their Timeline tool, which builds interactive timelines, Soundcite, which can create in-line audio in texts, and Juxtapose, a photo-comparison tool. All of these tools, like StoryMapJS, are completely free to use.
What are your favorite ways to teach with interactive tools? Let us know in the comments!