“Why don’t you make a concept map of what you’re reading?” I asked my thirteen-year-old daughter as she groaned about a homework assignment upstairs.
She looked at me, confused. “I don’t know how.”
I was stunned. How could a high school student not know how to create a concept map?
For years, I’ve relied on concept maps to organize key ideas and supporting details in a way that makes sense to me. But at that moment, I realized she had never been taught this simple yet powerful strategy. Let’s take a closer look at Concept Mapping. It’s not only for your students.
My Maps Look Horrible
When I crack open my paper notebooks, I’m always disappointed at the scrawled cursive script and the less than perfect ovals, squares of my concept maps. But I have a new appreciation for hand-drawn concept maps. As a teacher, I wish I’d had the BOOM Concept Model to share with my students, or my daughter.
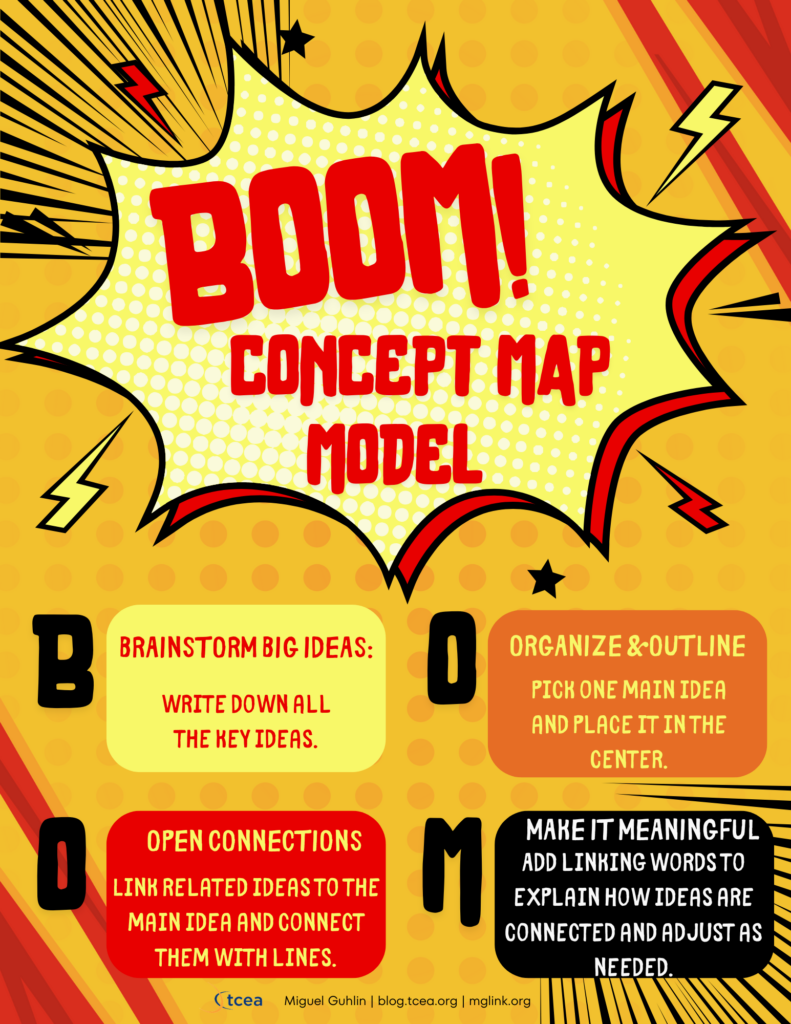
The steps to the B.O.O.M. Concept Map model are simple for any age:
- Brainstorm Big Ideas – Write down all the key ideas from your lesson.
- Organize & Outline – Pick one main idea and place it in the center.
- Open Connections – Link related ideas to the main idea and connect them with lines.
- Make It Meaningful – Add linking words to explain how ideas are connected and adjust as needed.
We’ll come back to BOOM in a moment. For now, let’s take a look at an example of BOOM in action. A great example of this is Cornell University’s concept map about the strategy:
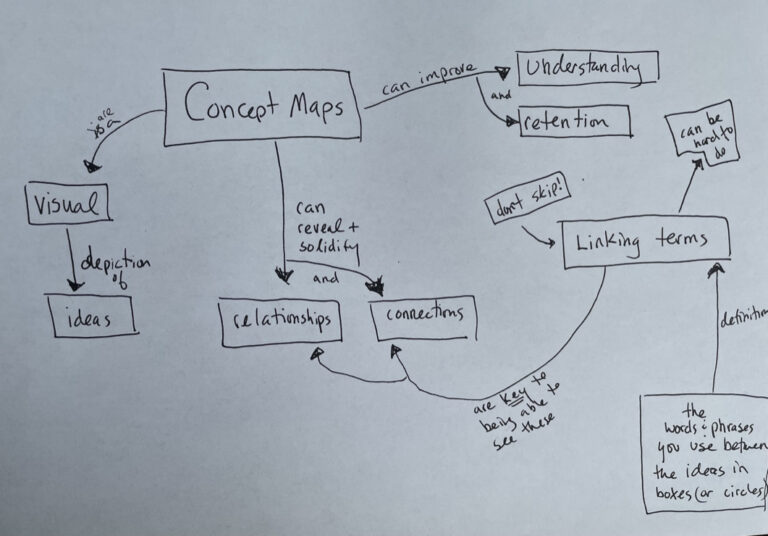
As you can imagine, Concept Mapping (effect size: 0.66) is one of the most effective strategies for helping students organize new learning. It excels because it makes connecting new information to prior knowledge easier.
So, it doesn’t matter how BAD my concept maps look. The act of making them by hand translates into more powerful learning. That’s learning that will cross the barrier from short-term to long-term memory.
Homeschooling Connection
In homeschooling, concept maps help parents customize lessons. They build independence, personalize learning, and link ideas across subjects.
Why Concept Mapping?
It may seem obvious as to why concept maps are so powerful. In addition to serving as a tool for metacognition, they assist students in:
✔ Organizing and structuring their knowledge
✔ Identifying relationships between concepts
✔ Enhancing critical thinking and problem-solving skills
✔ Improving long-term retention of information
According to John Hattie’s Visible Learning research, mapping is a high-effect size strategy, making it a valuable addition to any educator’s toolkit. To maximize its impact, we must integrate it into different learning phases: surface, deep, and transfer learning.
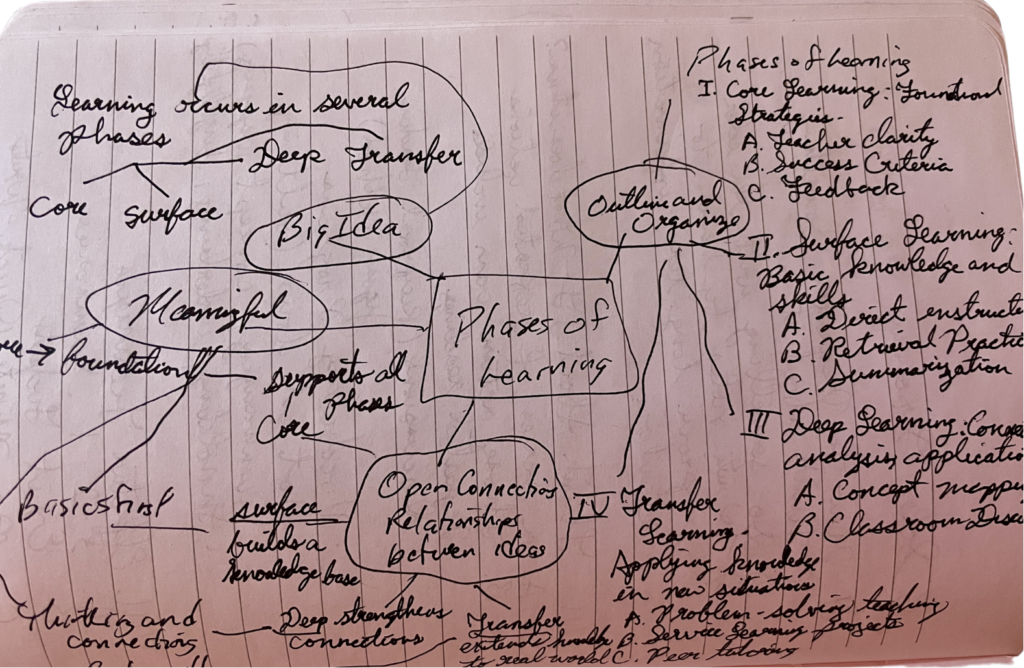
BOOMing the Phases of Learning
Applying B.O.O.M. to the Learning Phases
B – Brainstorm Big Ideas
- Learning occurs in four phases: core, surface, deep, and transfer.
O – Organize & Outline
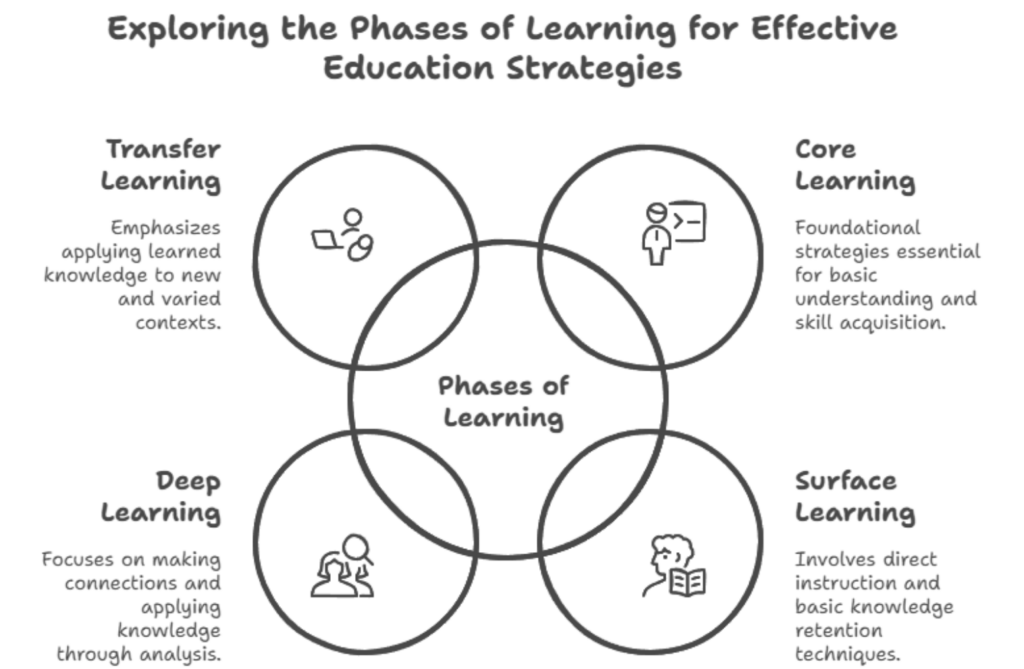
- Main Idea: Phases of Learning (center of concept map).
- Branches:
- Core Learning – Foundational strategies like teacher clarity & feedback.
- Surface Learning – Basic knowledge & skills (direct instruction, summarization, retrieval practice).
- Deep Learning – Connections, analysis, and application (concept mapping, discussions).
- Transfer Learning – Applying knowledge in new situations (problem-solving, projects, peer tutoring).
O – Open Connections
- Relationships between ideas:
- Core supports all phases by providing clarity and feedback.
- Surface builds a knowledge base necessary for deep understanding.
- Deep learning strengthens connections and allows for application.
- Transfer learning extends knowledge to real-world use.
M – Make It Meaningful
- Linking Terms:
- Core → Foundation → Supports all phases.
- Surface → Basics First → Prepares for deeper understanding.
- Deep → Thinking & Connecting → Builds critical thinking skills.
- Transfer → Real-World Use → Applies knowledge to new situations.
- Rearrange ideas as needed to clarify relationships.
There’s a reason why Outlining and Organizing enjoys an effect size of 0.84. I suspect that concept maps tap into the organizing part of of this strategy.
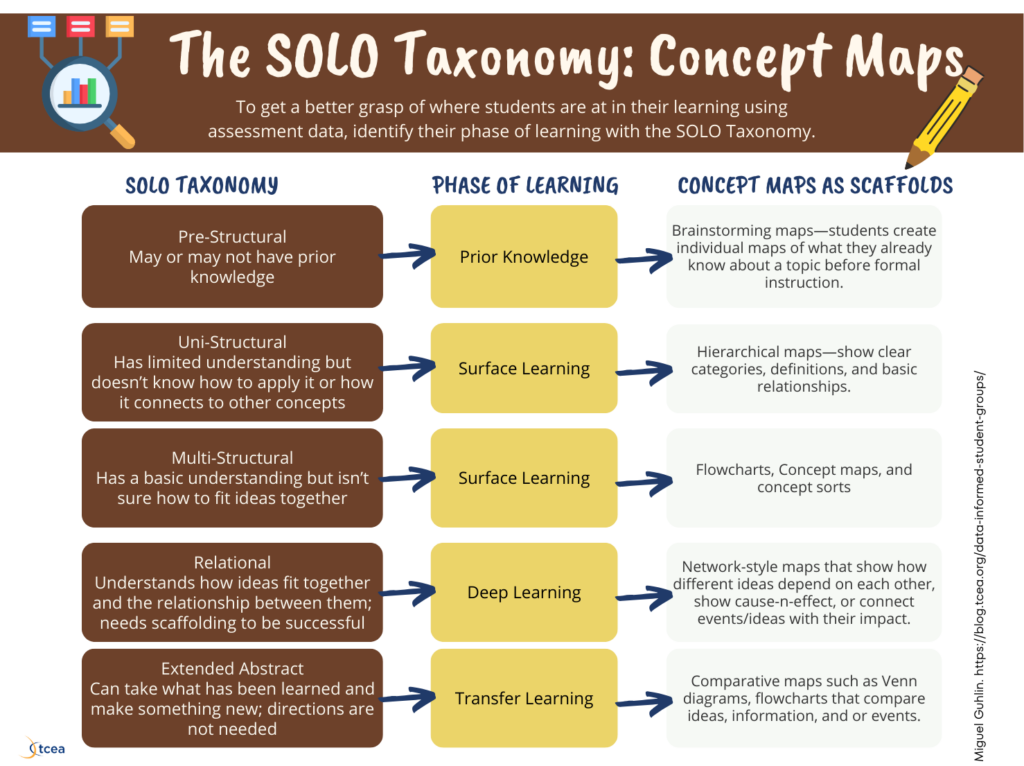
Using Concept Maps to Scaffold Learning
Let’s see how concept mapping can support the different phases of learning, as represented in The SOLO Taxonomy above.
1. Surface Learning: Organizing Key Concepts
At this stage, students are exposed to new information. Concept maps help them visually categorize foundational ideas, creating a structured overview.
- Example: A teacher introduces ecosystems by having students create a hierarchical concept map of biotic and abiotic factors.
- Digital Tools: Google Drawings, Canva, Padlet
Some grade level examples:
–Grade 3: Water Cycle—students create a flowchart showing precipitation, evaporation, and condensation.
- Grade 5: Geometry Vocabulary—students create a concept map showing different types of triangles and their properties.
- Grade 8: Parts of Speech—students group words into categories (nouns, verbs, adjectives) with examples.
Let’s take a look at Deep Learning, focused on showing how different ideas depend on each other.
2. Deep Learning: Making Connections
Once students have grasped basic concepts, concept maps help them analyze relationships and synthesize ideas. Network-style maps that show how different ideas depend on each other, show cause-n-effect, or connect events/ideas with their impact.
- Example: In history, students build a cause-and-effect map to show how events in the Industrial Revolution influenced economic and social change.
- Digital Tools: Miro, MindMeister, Lucidchart
Some grade level examples include:
- Grade 3: Ecosystems—students map out how different plants and animals depend on each other in a food web.
- Grade 5: Causes of the American Revolution—students create a cause-and-effect concept map linking taxation, protests, and war.
- Grade 8: Industrial Revolution—students create a web linking inventions (steam engine) to economic and social impacts (factory work).
3. Transfer Learning: Applying Knowledge to New Contexts
At this stage, students use their concept maps to apply knowledge in new or real-world situations. Comparative maps such as Venn diagrams, flowcharts that compare ideas, information, and or events.
- Example: Science students compare and contrast animal vs. plant cells, linking functions to broader biological principles.
- Digital Tools: Lucidchart, a digital whiteboard
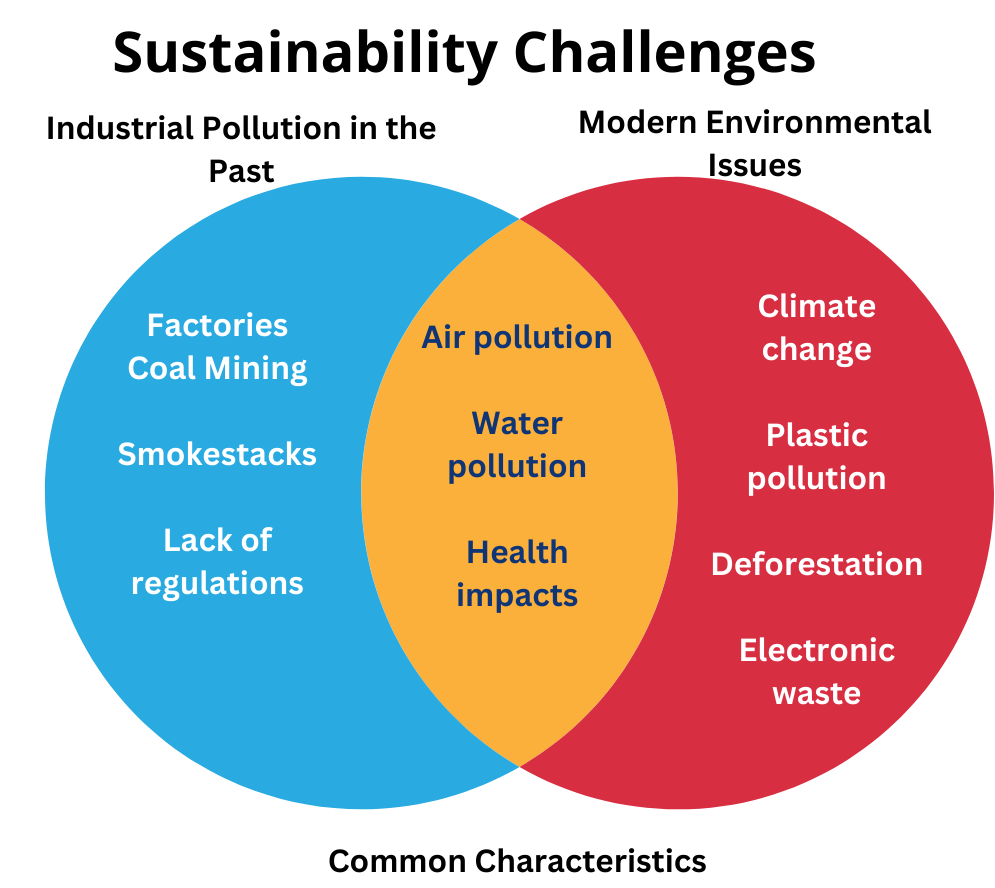
Some grade level examples include:
- Grade 3: Comparing Habitats—students use a Venn diagram to compare desert and rainforest ecosystems.
- Grade 5: Scientific Innovations Across Eras—students compare how past and present inventions shape daily life.
- Grade 8: Sustainability Challenges—students use a flowchart to compare industrial pollution in the past with modern environmental issues (see example above).
Private & Charter School Learning Connection:
Private and charter schools, with smaller classes and flexible instruction, can use concept mapping to boost engagement and teamwork. Teachers can add concept maps to projects, helping students connect ideas and solve real-world problems.
Making Concept Mapping More Effective
To maximize learning, concept maps should be:
- Student-Created: Encourage students to construct their own maps rather than using pre-made ones.
- Interactive: Allow students to revise and refine their maps over time as their understanding deepens.
- Collaborative: Have students work in pairs or groups to discuss and connect ideas.
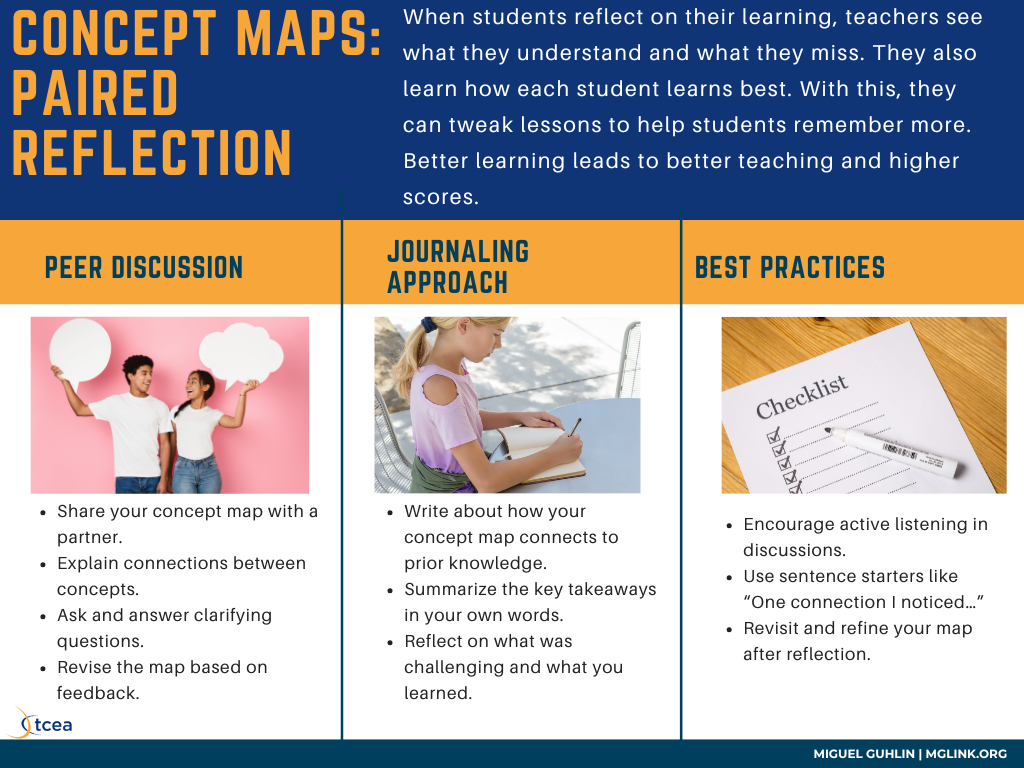
- Paired with Reflection: Encourage students to explain their concept maps to peers or through journaling.
Reflect and Connect
Let’s take a closer look at that last expectation about concept maps, “paired with reflection.” Often ignored in the classroom, students seldom are given time to reflect. Consider the following:
When students write reflectively about what they learned and how they learned it, the teacher gets valuable information about what the students did or did not get from a particular lesson. It also informs the teacher about the ways in which their students learn best. This knowledge can then be folded into subsequent lessons to enhance the learning and retention of students, thereby leading to improved teaching and improved academic outcomes. (source)
Ugly Concept Maps
While you can enhance your mapping with digital tools, remember to give students ample opportunity to make ugly concept maps.
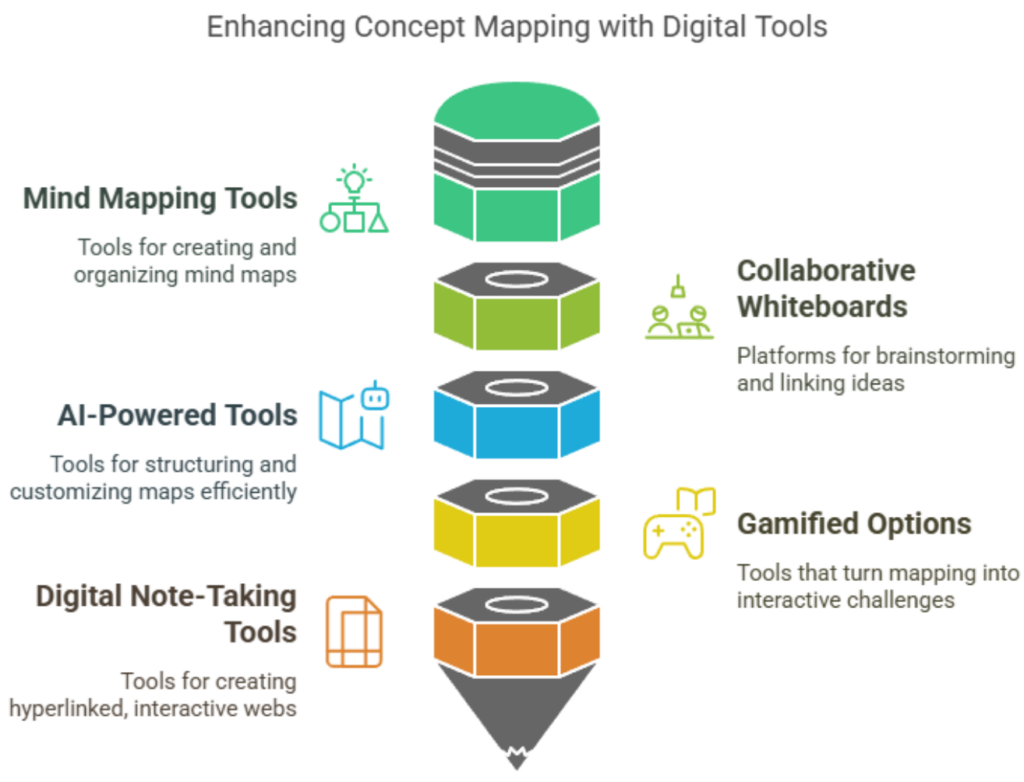
Of course, you can always use tools like Napkin.AI to “prettify” your organized outlines or maps AFTER you have drawn them by hand:
Final Thoughts
Concept mapping is more than just a graphic organizer. It offers an evidence-based, high-effect size instructional strategy that fosters deep, cognitive engagement. Pair it with digital tools to visualize connections, and MIX ideas.
How do you use concept mapping in your classroom? Share your experiences in the comments!

